2011 Torbay Council election
Elections to Torbay Council took place on Thursday 5 May 2011. All 36 seats on the council were up for election. The previous election also produced a majority for the Conservative Party.
| Party | Seats | Gains | Losses | Net gain/loss | Seats % | Votes % | Votes | +/− | |
|---|---|---|---|---|---|---|---|---|---|
| Conservative | 22 | 2 | 3 | – 1 | 61.1% | 41.8% | 36 262 | – 3.8% | |
| Liberal Democrats | 9 | 1 | 2 | – 1 | 25.0% | 28.7% | 24 875 | – 3.7% | |
| Labour | 1 | 1 | 0 | + 1 | 2.8% | 9.4% | 8 176 | + 6.3% | |
| Green | 0 | 0 | 0 | – | 0 | 7.3% | 6 311 | + 7.3% | |
| Voice 4 Torbay | 0 | 0 | 0 | – | 0 | 1.9% | 1 674 | + 1.9% | |
| UKIP | 1 | 1 | 0 | + 1 | 2.8% | 1.8% | 1 598 | – 7.4% | |
| English Radical | 0 | 0 | 0 | – | 0 | * | 145 | * | |
| Liberty | 0 | 0 | 0 | – | 0 | * | 73 | * | |
| Independent | 3 | 1 | 1 | 0 | 8.3% | 8.8% | 7 654 | + 1.0% | |
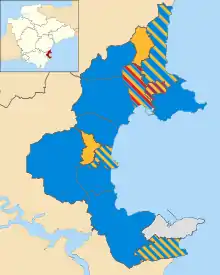
Map of results of 2011 election
Ward results
| Party | Candidate | Votes | % | ±% | |
|---|---|---|---|---|---|
| Independent | Jackie Stockman | 1 755 | 20.0% | + 20.0% | |
| Independent | Mike Morey | 1 740 | 19.8% | + 5.8% | |
| Independent | Vic Ellery | 1 698 | 19.3% | + 6.0% | |
| Conservative | Richard Haddock | 948 | 10.8% | – 1.1% | |
| Conservative | Peter McNamara | 778 | 8.8% | – 1.3% | |
| Conservative | Jane Moulder | 611 | 6.9% | – 2.7% | |
| Labour | Lynne Armstrong | 398 | 4.5% | + 3.6% | |
| Green | John Fallon | 309 | 3.5% | + 3.5% | |
| Liberal Democrats | Michael Byfield | 227 | 2.6% | – 4.1% | |
| Liberal Democrats | Philip McCallion | 175 | 2.0% | – 1.9% | |
| Liberal Democrats | Eileen Fox | 154 | 1.8% | – 1.6% | |
| Majority | |||||
| Turnout | 44.02% | ||||
| Independent gain from Conservative | Swing | ||||
| Independent hold | Swing | ||||
| Independent hold | Swing | ||||
| Party | Candidate | Votes | % | ±% | |
|---|---|---|---|---|---|
| Conservative | Jeanette Richards | 1 029 | 16.6% | + 0.5% | |
| Conservative | John Thomas | 990 | 16.0% | + 2.0% | |
| Conservative | David Thomas | 959 | 15.5% | + 1.2% | |
| Labour | Douglas Litt | 612 | 9.9% | + 3.6% | |
| Liberal Democrats | John Turner | 604 | 9.7% | – 0.6% | |
| Independent | Chris Robson | 548 | 8.8% | + 8.8% | |
| Green | Tracey White | 494 | 8.0% | + 8.0% | |
| Liberal Democrats | Robert Jack | 490 | 7.9% | – 2.0% | |
| Liberal Democrats | Gillian Fazan | 469 | 7.6% | – 1.3% | |
| Majority | |||||
| Turnout | 33.74% | ||||
| Conservative hold | Swing | ||||
| Conservative hold | Swing | ||||
| Conservative hold | Swing | ||||
| Party | Candidate | Votes | % | ±% | |
|---|---|---|---|---|---|
| Conservative | Derek Mills | 1 448 | 27.6% | – 2.0% | |
| Conservative | Ken Pritchard | 1 348 | 25.7% | – 2.0% | |
| Voice 4 Torbay | Roger Richards | 565 | 10.8% | + 10.8% | |
| Liberal Democrats | Dave Browne | 472 | 9.0% | – 6.7% | |
| Independent | Paul Clifford | 464 | 8.8% | + 8.8% | |
| Labour | Bill Ingham | 389 | 7.4% | + 7.4% | |
| Liberal Democrats | Lesley Stonier | 299 | 5.7% | – 8.3% | |
| Green | David Benson | 259 | 4.9% | + 4.9% | |
| Majority | |||||
| Turnout | 54.02% | ||||
| Conservative hold | Swing | ||||
| Conservative hold | Swing | ||||
| Party | Candidate | Votes | % | ±% | |
|---|---|---|---|---|---|
| Liberal Democrats | Ian Doggett | 859 | 20.8% | – 3.5% | |
| Liberal Democrats | Ruth Pentney | 799 | 19.3% | – 3.6% | |
| Conservative | Natalie Walsh | 740 | 17.9% | – 0.3% | |
| Conservative | Andy Westwood | 621 | 15.0% | – 1.9% | |
| Labour | David Pedrick-Friend | 421 | 10.2% | + 10.2% | |
| Labour | Edward Harris | 419 | 10.1% | + 10.1% | |
| Green | Maureen Bennett | 280 | 6.8% | + 6.8% | |
| Majority | |||||
| Turnout | 41.47% | ||||
| Liberal Democrats hold | Swing | ||||
| Liberal Democrats hold | Swing | ||||
| Party | Candidate | Votes | % | ±% | |
|---|---|---|---|---|---|
| Conservative | Gordon Oliver | 1 563 | 17.6% | + 2.8% | |
| Conservative | Nicole Amil | 1 276 | 14.3% | – 0.3% | |
| Conservative | Michael Hytche | 1 257 | 14.1% | + 0.2% | |
| Liberal Democrats | Gill Hayman | 1 157 | 13.0% | – 0.3% | |
| Liberal Democrats | Jean Cope | 1 011 | 11.4% | – 0.6% | |
| Liberal Democrats | Mark Pountney | 1 007 | 11.3% | – 0.1% | |
| Labour | Trevor Fine | 641 | 7.2% | + 4.9% | |
| Green | Thomas Cooper | 524 | 5.9% | + 5.9% | |
| Independent | Mark Dent | 460 | 5.2% | – 0.9% | |
| Majority | |||||
| Turnout | 33.82% | ||||
| Conservative hold | Swing | ||||
| Conservative hold | Swing | ||||
| Conservative hold | Swing | ||||
| Party | Candidate | Votes | % | ±% | |
|---|---|---|---|---|---|
| UKIP | Julien Parrott | 540 | 16.7% | + 2.0% | |
| Liberal Democrats | Cindy Stocks | 522 | 16.1% | – 0.2% | |
| Conservative | Anne Brooks | 435 | 13.5% | – 0.5% | |
| Conservative | Vince Williams | 370 | 11.4% | – 1.4% | |
| Liberal Democrats | David Poolman | 315 | 9.7% | – 1.7% | |
| UKIP | Jen Walsh | 294 | 9.1% | + 1.5% | |
| Labour | Patrick Canavan | 269 | 8.3% | + 1.0% | |
| Labour | Paul Raybould | 218 | 6.7% | + 6.7% | |
| Green | Virginia Allum | 149 | 4.6% | + 4.6% | |
| Green | Jim Fox | 122 | 3.8% | + 3.8% | |
| Majority | |||||
| Turnout | 33.82% | ||||
| UKIP gain from Independent | Swing | ||||
| Liberal Democrats hold | Swing | ||||
| Party | Candidate | Votes | % | ±% | |
|---|---|---|---|---|---|
| Conservative | Jane Barnby | 942 | 20.9% | no change | |
| Conservative | Alan Tyerman | 820 | 18.2% | – 1.7% | |
| Liberal Democrats | Christine Carter | 721 | 16.0% | – 5.8% | |
| Liberal Democrats | Sue Biles | 719 | 16.0% | – 4.9% | |
| UKIP | Gary Booth | 446 | 9.9% | + 0.9% | |
| Labour | Rosalind Royle | 338 | 7.5% | + 7.5% | |
| UKIP | Janet Hunt | 318 | 7.1% | – 0.4% | |
| Green | Jana Soroka | 197 | 4.4% | + 4.4% | |
| Majority | |||||
| Turnout | 33.82% | ||||
| Conservative hold | Swing | ||||
| Conservative gain from Liberal Democrats | Swing | ||||
| Party | Candidate | Votes | % | ±% | |
|---|---|---|---|---|---|
| Conservative | Dave Butt | 1 819 | 20.2% | + 2.8% | |
| Conservative | Chris Lewis | 1 638 | 18.2% | + 2.6% | |
| Conservative | Christine Scouler | 1 575 | 17.5% | + 2.0% | |
| Liberal Democrats | Linda Turner | 900 | 10.0% | + 4.1% | |
| Liberal Democrats | Maggi Dunbar | 772 | 8.6% | + 2.8% | |
| Liberal Democrats | Beverley Brennan | 757 | 8.4% | + 3.6% | |
| Labour | Stephen Turner | 599 | 6.7% | + 4.0% | |
| Green | Mark Sangan | 499 | 5.6% | + 5.6% | |
| Green | Hannah Dumont | 425 | 4.7% | + 4.7% | |
| Majority | |||||
| Turnout | 45.46% | ||||
| Conservative hold | Swing | ||||
| Conservative hold | Swing | ||||
| Conservative hold | Swing | ||||
| Party | Candidate | Votes | % | ±% | |
|---|---|---|---|---|---|
| Conservative | John Brooksbank | 624 | 17.0% | – 11.1% | |
| Liberal Democrats | Bobbie Davies | 588 | 16.0% | – 3.7% | |
| Conservative | Graham Scouler | 543 | 14.8% | – 11.3% | |
| Green | Sam Moss | 491 | 13.4% | + 13.4% | |
| Liberal Democrats | Andrew Dunbar | 479 | 13.0% | – 4.6% | |
| Green | Paula Hermes | 375 | 10.2% | + 10.2% | |
| Labour | Irene Reade | 354 | 9.6% | + 1.3% | |
| English Radical | Rick Heyse | 145 | 3.9% | + 3.9% | |
| Liberty | Simon Slade | 73 | 2.0% | + 2.0% | |
| Majority | |||||
| Turnout | 38.15% | ||||
| Conservative hold | Swing | ||||
| Liberal Democrats gain from Conservative | Swing | ||||
| Party | Candidate | Votes | % | ±% | |
|---|---|---|---|---|---|
| Liberal Democrats | Alan Faulkner | 1 473 | 16.5% | + 1.6% | |
| Conservative | Pete Addis | 1 436 | 16.1% | + 0.4% | |
| Conservative | Ray Hill | 1 165 | 13.0% | – 1.8% | |
| Conservative | Rachel Ives | 1 118 | 12.5% | – 2.2% | |
| Liberal Democrats | Alan Griffey | 1 036 | 11.6% | – 2.1% | |
| Liberal Democrats | Hamish Renton | 819 | 9.2% | – 3.6% | |
| Voice 4 Torbay | Fiona McPhail | 602 | 6.7% | + 6.7% | |
| Labour | John Mellor | 539 | 6.0% | + 6.0% | |
| Green | Steven Luscombe | 378 | 4.2% | + 4.2% | |
| Green | Sean Collinson | 377 | 4.2% | + 4.2% | |
| Majority | |||||
| Turnout | 41.32% | ||||
| Liberal Democrats hold | Swing | ||||
| Conservative hold | Swing | ||||
| Conservative hold | Swing | ||||
| Party | Candidate | Votes | % | ±% | |
|---|---|---|---|---|---|
| Conservative | Matthew James | 644 | 17.4% | – 9.1% | |
| Liberal Democrats | Andrew Baldrey | 570 | 15.4% | – 4.9% | |
| Conservative | Terry Manning | 556 | 15.0% | – 11.8% | |
| Independent | Martyn Hodge | 482 | 13.0% | + 13.0% | |
| Labour | Rosemary Clark | 396 | 10.7% | + 10.7% | |
| Labour | Philip Gregory | 367 | 9.9% | + 9.9% | |
| Liberal Democrats | Hayley Darby | 367 | 9.9% | – 7.6% | |
| Independent | Nick Henderson | 351 | 9.5% | + 9.5% | |
| Green | Andy Wilson | 184 | 5.0% | + 5.0% | |
| Independent | Gordon Boote | 156 | 4.2% | + 4.2% | |
| Majority | |||||
| Turnout | 41.64% | ||||
| Conservative hold | Swing | ||||
| Liberal Democrats hold | Swing | ||||
| Party | Candidate | Votes | % | ±% | |
|---|---|---|---|---|---|
| Conservative | Mark Kingscote | 1 163 | 24.5% | + 1.7% | |
| Conservative | Alison Hernandez | 1 073 | 22.5% | + 3.2% | |
| Liberal Democrats | Colin Charlwood | 989 | 20.8% | – 0.3% | |
| Liberal Democrats | Elizabeth Brosnan | 806 | 17.0% | – 1.5% | |
| Labour | Leonora Critchlow | 535 | 11.3% | + 5.5% | |
| Green | Hazel Robertson | 189 | 4.0% | + 4.0% | |
| Majority | |||||
| Turnout | 39.05% | ||||
| Conservative hold | Swing | ||||
| Conservative gain from Liberal Democrats | Swing | ||||
| Party | Candidate | Votes | % | ±% | |
|---|---|---|---|---|---|
| Liberal Democrats | Jenny Faulkner | 1 055 | 17.0% | + 4.2% | |
| Conservative | Robert Excell | 947 | 15.2% | + 3.1% | |
| Labour | Darren Cowell | 825 | 13.3% | + 9.8% | |
| Conservative | Sylvia Faryna | 768 | 12.3% | – 0.3% | |
| Liberal Democrats | Tracey Samways | 588 | 9.4% | – 1.2% | |
| Liberal Democrats | Barrie Wood | 564 | 9.1% | – 0.3% | |
| Conservative | Christopher Clark | 524 | 8.4% | – 3.0% | |
| Voice 4 Torbay | Julie Brandon | 507 | 8.1% | + 8.1% | |
| Green | Martin Fox | 445 | 7.2% | + 7.2% | |
| Majority | |||||
| Turnout | 33.31% | ||||
| Liberal Democrats hold | Swing | ||||
| Conservative hold | Swing | ||||
| Labour gain from Conservative | Swing | ||||
| Party | Candidate | Votes | % | ±% | |
|---|---|---|---|---|---|
| Liberal Democrats | Steve Darling | 1 122 | 28.8% | – 1.2% | |
| Liberal Democrats | Roger Stringer | 1 025 | 26.3% | – 1.4% | |
| Conservative | Bruce Cowling | 574 | 14.8% | – 6.6% | |
| Conservative | Jackie Perrins | 502 | 12.9% | – 8.0% | |
| Labour | Jermaine Atiya-Alla | 457 | 11.7% | + 11.7% | |
| Green | Virginia Compton | 211 | 5.4% | + 5.4% | |
| Majority | |||||
| Turnout | 41.36% | ||||
| Liberal Democrats hold | Swing | ||||
| Liberal Democrats hold | Swing | ||||
| Party | Candidate | Votes | % | ±% | |
|---|---|---|---|---|---|
| Conservative | Neil Bent | 1 798 | 33.8% | – 6.8% | |
| Conservative | Beryl McPhail | 1 760 | 33.1% | – 7.1% | |
| Liberal Democrats | Alastair Peart | 519 | 9.8% | – 0.2% | |
| Liberal Democrats | Samuel Rooney | 446 | 8.4% | – 0.9% | |
| Green | Joanne McQuillan | 403 | 7.6% | + 7.6% | |
| Labour | Sandra Berry | 397 | 7.5% | + 7.5% | |
| Majority | |||||
| Turnout | 45.62% | ||||
| Conservative hold | Swing | ||||
| Conservative hold | Swing | ||||
See also
References
This article is issued from Wikipedia. The text is licensed under Creative Commons - Attribution - Sharealike. Additional terms may apply for the media files.