2011 Brighton and Hove City Council election
Elections to Brighton and Hove City Council were held on 5 May 2011, in line with other local elections in the United Kingdom. The whole council, a unitary authority, was up for election with 54 councillors elected from 21 wards.
| |||||||||||||||||||||||||||||||||
All 54 council seats 28 seats needed for a majority | |||||||||||||||||||||||||||||||||
|---|---|---|---|---|---|---|---|---|---|---|---|---|---|---|---|---|---|---|---|---|---|---|---|---|---|---|---|---|---|---|---|---|---|
| |||||||||||||||||||||||||||||||||
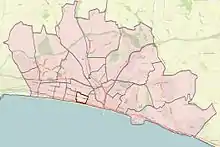
 Map of results of 2011 election | |||||||||||||||||||||||||||||||||
| |||||||||||||||||||||||||||||||||
The Green Party made significant gains, overtaking the Conservatives to become the largest party with 23 seats, the largest Green group on any council. The Greens gained seats at the expense of all three other parties, taking the only ward previously in Liberal Democrat hands. The Conservatives lost not only to the Greens but to Labour Co-op candidates in different parts of the city.[1]
The Greens, Conservatives and Labour Co-op fielded candidates for every seat on the council. The Liberal Democrats contested all but one ward. The UK Independence Party, European Citizens Party and Trade Unionists and Socialists Against Cuts also fielded candidates. In addition, there were six independents standing, including re-standing councillor and former Liberal Democrat David Watkins.[2]
Following the election the Labour Co-operative group rejected the possibility of forming a coalition with the Green Party, who then went on to form the first ever Green council administration in the UK, as a minority administration.[3][4] As of 2018, it is the most recent local authority election in which the Green Party of England and Wales won the most votes and seats.
Following the election, the composition of the council was as follows:
Green: 23 Conservative: 18 Labour: 13
Changes between 2007 and 2011 elections
Since the 2007 Council Election there were a number of changes to the make up of the council:
In the Regency, Goldsmid and St. Peter's & North Laine wards there were by-elections, all of which were won or held by the Green Party. In Brunswick and Adelaide one councillor, David Watkins resigned from the Liberal Democrats and stood as an independent in this election. Jayne Bennett, who was elected as an Independent in the 2007 election in the Stanford/Hove Park ward, rejoined the Conservative Party (which she had left in 2002[5]), and stood as such in 2011.
Two ward names were changed during the four-year period: Hollingbury and Stanmer became Hollingdean and Stanmer, and Stanford ward was renamed Hove Park, using the council's powers under the Local Government and Public Involvement in Health Act 2007.
Results of election
| Party | Seats | Gains | Losses | Net gain/loss | Seats % | Votes % | Votes | +/− | |
|---|---|---|---|---|---|---|---|---|---|
| Green | 23 | 10 | 0 | +10 | 42.59 | 32.75 | 73,832 | +12.06 | |
| Conservative | 18 | 0 | 8 | -8 | 33.33 | 28.76 | 64,837 | -6.08 | |
| Labour | 13 | 5 | 5 | 0 | 24.07 | 31.82 | 71,738 | +7.00 | |
| Liberal Democrats | 0 | 0 | 1 | -1 | 0 | 5.47 | 12,326 | -5.09 | |
| Independent | 0 | 0 | 1 | -1 | 0 | 0.78 | 1,765 | -4.54 | |
| UKIP | 0 | 0 | 0 | 0 | 0 | 0.41 | 918 | +0.06 | |
| TUSC | 0 | 0 | 0 | 0 | 0 | 0.33 | 758 | N/A | |
| European Citizens Party | 0 | 0 | 0 | 0 | 0 | 0.03 | 76 | N/A | |
Ward breakdown
Brunswick and Adelaide
| Party | Candidate | Votes | % | ±% | |
|---|---|---|---|---|---|
| Green | Phélim Mac Cafferty | 1,140 | 20.07 | +8.21 | |
| Green | Ollie Sykes | 1,135 | 19.30 | +8.69 | |
| Liberal Democrats | Paul Elgood | 919 | 15.63 | -7.55 | |
| Labour | Ray Barnes | 622 | 10.58 | +3.59 | |
| Labour | Rob Macey | 611 | 10.34 | +3.87 | |
| Liberal Democrats | Brian Stone | 502 | 8.54 | -9.40 | |
| Conservative | Richard Latham | 395 | 6.72 | -2.34 | |
| Conservative | Adam Campbell | 394 | 6.70 | -2.08 | |
| Independent | David Watkins | 163 | 2.77 | -15.17 | |
| UKIP | Mark Cribb | 69 | 1.17 | N/A | |
| Turnout | 3,138 | 41.8 | +13.1 | ||
| Green gain from Liberal Democrats | Swing | +15.76 | |||
| Green gain from Independent | Swing | +23.86 | |||
Central Hove

| Party | Candidate | Votes | % | ±% | |
|---|---|---|---|---|---|
| Green | Chris Hawtree | 1,006 | 17.73 | +8.81 | |
| Conservative | Andrew Wealls | 972 | 17.13 | -3.35 | |
| Conservative | Jan Young | 932 | 16.43 | -2.71 | |
| Green | Anthea Ballam | 819 | 14.44 | +7.37 | |
| Labour | Celia Barlow | 704 | 12.41 | +5.68 | |
| Labour | Caroline Penn | 594 | 10.47 | +4.01 | |
| Liberal Democrats | Mark Collins | 347 | 6.12 | -8.58 | |
| Liberal Democrats | Rebecca Taylor | 299 | 5.27 | -8.90 | |
| Turnout | 2988 | 42.7 | +8.7 | ||
| Green gain from Conservative | Swing | +13.51 | |||
| Conservative hold | Swing | -3.09 | |||
East Brighton

| Party | Candidate | Votes | % | ±% | |
|---|---|---|---|---|---|
| Labour | Gill Mitchell | 2,059 | 18.41 | +2.63 | |
| Labour | Warren Morgan | 1,862 | 16.65 | +2.92 | |
| Labour | Craig Turton | 1,616 | 14.45 | +2.09 | |
| Green | Alison Ghanimi | 955 | 8.54 | +2.46 | |
| Conservative | Peter Booth | 940 | 8.40 | -1.40 | |
| Conservative | Chris Sandland | 826 | 7.38 | -2.39 | |
| Green | Lianna Etkind | 815 | 7.29 | +2.71 | |
| Conservative | Kelvin Poplett | 803 | 7.18 | -1.94 | |
| Green | Pip Tindall | 627 | 5.61 | +1.25 | |
| Liberal Democrats | Paul Chandler | 323 | 2.89 | -1.04 | |
| Liberal Democrats | Bruce Neave | 218 | 1.95 | -1.97 | |
| Liberal Democrats | Bill North | 142 | 1.27 | -2.42 | |
| Turnout | 4,045 | 39.5 | +4.1 | ||
| Labour hold | Swing | +0.07 | |||
| Labour hold | Swing | +4.29 | |||
| Labour hold | Swing | +3.82 | |||
Goldsmid

| Party | Candidate | Votes | % | ±% | |
|---|---|---|---|---|---|
| Green | Ruth Buckley | 2,264 | 14.19 | +7.51 | |
| Green | Alexandra Phillips | 2,204 | 13.82 | +7.72 | |
| Green | Rob Jarrett | 1,898 | 11.90 | +3.80 | |
| Labour | Melanie Davis | 1,755 | 11.00 | +1.13 | |
| Labour | Nigel Jenner | 1,516 | 9.50 | -0.13 | |
| Conservative | Adam Love | 1,428 | 8.96 | -1.71 | |
| Conservative | Rob Buckwell | 1,420 | 8.90 | -1.03 | |
| Conservative | Debra Livingstone-Wade | 1,333 | 8.25 | -1.29 | |
| Labour | Lis Telcs | 1,271 | 7.97 | -0.84 | |
| Liberal Democrats | Andrew Malling | 312 | 1.96 | -2.92 | |
| Liberal Democrats | Gloria Parks | 281 | 1.76 | -4.01 | |
| Liberal Democrats | John Aloy | 269 | 1.69 | -2.37 | |
| Turnout | 5,566 | 56.6 | +19.1 | ||
| Green gain from Conservative | Swing | +9.80 | |||
| Green hold | Swing | +8.75 | |||
| Green gain from Labour | Swing | +2.67 | |||
Hangleton and Knoll

| Party | Candidate | Votes | % | ±% | |
|---|---|---|---|---|---|
| Conservative | Dawn Barnett | 2,412 | 16.73 | -2.00 | |
| Labour | Brian Fitch | 2,139 | 14.84 | +1.98 | |
| Conservative | Tony Janio | 2,056 | 14.26 | -1.54 | |
| Conservative | Michael Ireland | 1,884 | 13.07 | -2.58 | |
| Labour | Dominic Ford | 1,855 | 12.87 | +2.17 | |
| Labour | Alun Jones | 1,778 | 12.33 | +1.67 | |
| Liberal Democrats | Jo Heard | 688 | 4.77 | +2.10 | |
| Green | Martin Ashby | 492 | 3.41 | +1.14 | |
| Green | Adele Bates | 379 | 2.63 | +0.83 | |
| Liberal Democrats | Lawrence Collins | 326 | 2.26 | +0.42 | |
| Green | Nic Compton | 265 | 1.84 | +0.07 | |
| Liberal Democrats | Dinah Staples | 143 | 0.99 | -0.41 | |
| Turnout | 5,121 | 46.9 | +1.3 | ||
| Conservative hold | Swing | -4.17 | |||
| Labour gain from Conservative | Swing | +4.56 | |||
| Conservative hold | Swing | -3.06 | |||
Hanover and Elm Grove

| Party | Candidate | Votes | % | ±% | |
|---|---|---|---|---|---|
| Green | Bill Randall | 2,861 | 18.84 | +0.23 | |
| Green | Matt Follett | 2,800 | 18.44 | +0.51 | |
| Green | Liz Wakefield | 2,576 | 16.97 | +0.38 | |
| Labour | Leo Barraclough | 1,662 | 10.95 | +2.17 | |
| Labour | Tracey Hill | 1,661 | 10.94 | -0.33 | |
| Labour | David Speirs | 1,606 | 10.58 | +2.52 | |
| Conservative | Rosemary Faulkner | 499 | 3.29 | -0.82 | |
| Conservative | Roger McCabe | 441 | 2.90 | -1.01 | |
| Conservative | Karen Miles | 434 | 2.86 | -0.65 | |
| Liberal Democrats | Elliot Eke | 189 | 1.24 | -1.60 | |
| Liberal Democrats | Raymond Parker | 159 | 1.05 | -1.17 | |
| TUSC | John Redford | 156 | 1.03 | N/A | |
| Liberal Democrats | Belkasim Gahran | 140 | 0.92 | -1.26 | |
| Turnout | 5,411 | 46.7 | +10.1 | ||
| Green hold | Swing | +0.55 | |||
| Green hold | Swing | -1.65 | |||
| Green hold | Swing | -2.14 | |||
Hollingdean and Stanmer

| Party | Candidate | Votes | % | ±% | |
|---|---|---|---|---|---|
| Green | Sven Rufus | 1,753 | 13.58 | +5.78 | |
| Green | Christina Summers | 1,748 | 13.55 | +7.16 | |
| Labour | Jeane Lepper | 1,681 | 13.03 | -2.07 | |
| Labour | Pat Hawkes | 1,557 | 12.07 | +0.13 | |
| Green | Luke Walter | 1,523 | 11.80 | +6.95 | |
| Labour | Christine Simpson | 1,511 | 11.71 | -0.23 | |
| Conservative | Rachael Bates | 767 | 5.94 | -3.60 | |
| Conservative | Patrick Lowe | 761 | 5.90 | -3.57 | |
| Conservative | Rob Labs | 732 | 5.67 | -3.72 | |
| UKIP | Nigel Carter | 166 | 1.29 | N/A | |
| Liberal Democrats | Oliver Eke | 138 | 1.07 | -3.27 | |
| Liberal Democrats | Emma Harrop | 127 | 0.98 | -2.27 | |
| TUSC | Tony Greenstein | 126 | 0.98 | -1.66 | |
| TUSC | Phil Clarke | 120 | 0.93 | N/A | |
| Liberal Democrats | Lillian Harrop | 105 | 0.81 | -2.24 | |
| TUSC | Dave Hill | 89 | 0.67 | N/A | |
| Turnout | 4,662 | 39.7 | +9.07 | ||
| Green gain from Labour | Swing | +4.06 | |||
| Green gain from Labour | Swing | +4.39 | |||
| Labour hold | Swing | -4.33 | |||
Hove Park

| Party | Candidate | Votes | % | ±% | |
|---|---|---|---|---|---|
| Conservative | Jayne Bennett | 2,557 | 35.01 | +4.66 | |
| Conservative | Vanessa Brown | 2,368 | 32.43 | +0.63 | |
| Labour | John Cooper | 661 | 9.05 | +5.31 | |
| Labour | Bernie Katz | 505 | 6.91 | +3.75 | |
| Green | Gavin Graham | 458 | 6.27 | +2.20 | |
| Green | Jane Prisley | 292 | 4.00 | +2.15 | |
| Liberal Democrats | Anna Gerrard | 198 | 2.71 | -0.11 | |
| Liberal Democrats | Manrico Oliveri | 158 | 2.16 | +0.37 | |
| UKIP | Sasha Stephens | 106 | 1.45 | N/A | |
| Turnout | 3,771 | 46.9 | -3.53 | ||
| Conservative hold | Swing | +16.03 | |||
| Conservative hold | Swing | -2.21 | |||
Moulsecoomb and Bevendean

| Party | Candidate | Votes | % | ±% | |
|---|---|---|---|---|---|
| Labour | Mo Marsh | 1,721 | 15.98 | +3.45 | |
| Labour | Leigh Farrow | 1,666 | 15.47 | +5.04 | |
| Labour | Anne Meadows | 1,663 | 15.44 | +2.92 | |
| Green | Allie Cannell | 1,080 | 10.03 | +1.27 | |
| Conservative | Maria Caulfield | 1,048 | 9.73 | -2.37 | |
| Conservative | Cath Slater | 863 | 8.01 | -4.08 | |
| Green | Kelly Dibbert | 852 | 7.91 | +3.52 | |
| Conservative | Ayas Fallon-Khan | 838 | 7.78 | -4.07 | |
| Green | Amelia Mills | 772 | 7.17 | +3.08 | |
| TUSC | Dave Bangs | 267 | 2.48 | -1.77 | |
| Turnout | 3,868 | 31.8 | +4.62 | ||
| Labour hold | Swing | +5.52 | |||
| Labour gain from Conservative | Swing | +7.41 | |||
| Labour hold | Swing | +6.76 | |||
North Portslade

| Party | Candidate | Votes | % | ±% | |
|---|---|---|---|---|---|
| Labour | Bob Carden | 1,596 | 29.82 | +7.07 | |
| Labour | Penny Gilbey | 1,240 | 23.16 | +3.62 | |
| Conservative | Trevor Alford | 1,010 | 18.87 | -2.70 | |
| Conservative | Kerry Underhill | 639 | 11.94 | -8.77 | |
| Green | Jacob Chapman | 245 | 4.58 | +1.01 | |
| UKIP | Maria McCallum | 155 | 2.90 | N/A | |
| Green | Dave Walsh | 130 | 2.43 | -1.06 | |
| Liberal Democrats | Ali Haydor | 126 | 2.35 | -2.51 | |
| Liberal Democrats | Billie Lewis | 106 | 1.98 | -1.51 | |
| Independent | Theo Child | 106 | 1.98 | N/A | |
| Turnout | 3,030 | 39.6 | |||
| Labour hold | Swing | +15.84 | |||
| Labour gain from Conservative | Swing | +6.32 | |||
Patcham

| Party | Candidate | Votes | % | ±% | |
|---|---|---|---|---|---|
| Conservative | Brian Pidgeon | 2,187 | 15.81 | -4.96 | |
| Conservative | Carol Theobald | 2,059 | 14.88 | -5.53 | |
| Conservative | Geoffrey Theobald | 2,042 | 14.76 | -5.34 | |
| Green | Hugh Woodhouse | 1,433 | 10.36 | +7.00 | |
| Green | Geraldine Keenan | 1,338 | 9.67 | +4.79 | |
| Green | Linda McRae | 1,274 | 9.91 | +6.73 | |
| Labour | Christine Moody | 1,151 | 8.32 | +2.21 | |
| Labour | Jatin Patel | 960 | 6.94 | -0.07 | |
| Labour | Rosemary Collins | 735 | 5.31 | -0.67 | |
| Liberal Democrats | Philip Wray | 252 | 1.82 | -1.39 | |
| Liberal Democrats | Christopher Hurley | 219 | 1.58 | -1.13 | |
| Liberal Democrats | Lawrence Eke | 186 | 0.95 | -1.37 | |
| Turnout | 5,092 | 46.74 | +2.80 | ||
| Conservative hold | Swing | -8.31 | |||
| Conservative hold | Swing | -9.09 | |||
| Conservative hold | Swing | -9.27 | |||
Preston Park

| Party | Candidate | Votes | % | ±% | |
|---|---|---|---|---|---|
| Green | Amy Kennedy | 2,616 | 16.12 | +3.75 | |
| Green | Mike Jones | 2,564 | 15.80 | +6.82 | |
| Green | Leo Littman | 2,291 | 14.12 | +6.34 | |
| Labour | Kevin Allen | 2,104 | 12.97 | +1.81 | |
| Labour | Juliet McCaffery | 2,063 | 12.71 | +0.36 | |
| Labour | Tim Lunnon | 1,848 | 11.39 | +1.36 | |
| Conservative | Clive Brimmell | 743 | 4.58 | -1.14 | |
| Conservative | Georgina Dore | 726 | 4.47 | -1.18 | |
| Conservative | William Mills | 667 | 4.11 | -1.37 | |
| Liberal Democrats | Tallulah Frankland | 218 | 1.34 | -1.98 | |
| Liberal Democrats | Keith Tipping | 179 | 1.10 | -1.16 | |
| Liberal Democrats | Lee Shingles | 169 | 1.04 | -0.98 | |
| The European Citizens Party | Yuri Borgmann-Prebil | 37 | 0.23 | N/A | |
| Turnout | 5,708 | 52.76 | +7.85 | ||
| Green hold | Swing | +0.81 | |||
| Green gain from Labour | Swing | +5.46 | |||
| Green gain from Labour | Swing | +6.11 | |||
Queen's Park

| Party | Candidate | Votes | % | ±% | |
|---|---|---|---|---|---|
| Green | Geoffrey Bowden | 2,227 | 14.72 | +0.46 | |
| Green | Stephanie Powell | 2,221 | 14.68 | +2.58 | |
| Green | Ben Duncan | 2,147 | 14.19 | +2.69 | |
| Labour | Daniel Chapman | 1,970 | 13.02 | +1.63 | |
| Labour | Christopher Cooke | 1,867 | 12.34 | +0.98 | |
| Labour | Tom French | 1,822 | 12.04 | +0.97 | |
| Conservative | Philip Brownlie | 766 | 5.06 | -2.17 | |
| Conservative | Anne Glow | 738 | 4.88 | -1.52 | |
| Conservative | Gail Woodcock | 653 | 4.32 | -1.55 | |
| Liberal Democrats | Elizabeth Robinson | 237 | 1.57 | -1.31 | |
| Liberal Democrats | Jacob Frohawk-Mclucas | 189 | 1.25 | -1.59 | |
| Liberal Democrats | Brian Ralfe | 155 | 1.02 | -1.35 | |
| Independent | Mohammed Asaduzzaman | 140 | 0.93 | N/A | |
| Turnout | 5,335 | 45.49 | +5.50 | ||
| Green hold | Swing | -1.17 | |||
| Green hold | Swing | +1.60 | |||
| Green hold | Swing | +1.72 | |||
Regency

| Party | Candidate | Votes | % | ±% | |
|---|---|---|---|---|---|
| Green | Ania Kitcat | 1,696 | 28.53 | +11.34 | |
| Green | Jason Kitcat | 1,629 | 27.40 | +11.30 | |
| Labour | James Asser | 691 | 11.62 | -0.03 | |
| Labour | Dan Wilson | 665 | 11.19 | +1.98 | |
| Conservative | Andrew Hancox | 494 | 8.31 | -2.33 | |
| Conservative | Michael MacFarlane | 449 | 7.55 | -3.27 | |
| Liberal Democrats | Gareth Jones | 166 | 2.79 | -6.57 | |
| Liberal Democrats | Larissa Rowe | 155 | 2.61 | -6.15 | |
| Turnout | 3,092 | 38.91 | |||
| Green hold | Swing | +11.37 | |||
| Green hold | Swing | +10.93 | |||
Rottingdean Coastal

| Party | Candidate | Votes | % | ±% | |
|---|---|---|---|---|---|
| Conservative | Lynda Hyde | 2,642 | 19.19 | -1.49 | |
| Conservative | Mary Mears | 2,433 | 17.67 | -1.99 | |
| Conservative | David Smith | 2,219 | 16.12 | -3.65 | |
| Labour | Tony Frisby | 1,053 | 7.65 | +3.37 | |
| Labour | Michael Adams | 1,044 | 7.58 | +4.23 | |
| Green | Andrew Coleman | 1,000 | 7.26 | +0.38 | |
| Labour | Harris Fitch | 931 | 6.76 | +3.42 | |
| Green | Rebecca Duffy | 692 | 5.03 | -1.07 | |
| Green | Stuart Hay | 679 | 4.93 | -0.80 | |
| Liberal Democrats | Harry Dienes | 483 | 3.51 | -0.61 | |
| Liberal Democrats | Barry Pinchen | 310 | 2.25 | -1.37 | |
| Liberal Democrats | Paul Perrin | 283 | 2.06 | -0.42 | |
| Turnout | 4,992 | 46.52 | +4.77 | ||
| Conservative hold | Swing | -2.26 | |||
| Conservative hold | Swing | -3.84 | |||
| Conservative hold | Swing | -4.81 | |||
South Portslade

| Party | Candidate | Votes | % | ±% | |
|---|---|---|---|---|---|
| Labour | Leslie Hamilton | 1,580 | 28.04 | +6.70 | |
| Labour | Alan Robins | 1,234 | 21.90 | +2.87 | |
| Conservative | Stephen Harbor-Wade | 941 | 16.70 | -3.15 | |
| Conservative | Steve Harmer-Strange | 830 | 14.73 | -5.50 | |
| Green | Cathy Marchland | 398 | 7.06 | +1.05 | |
| Green | Steve Watson | 263 | 4.67 | +1.07 | |
| Liberal Democrats | Ken Rist | 208 | 3.69 | -1.63 | |
| Liberal Democrats | Peter Denyer | 180 | 3.19 | -1.42 | |
| Turnout | 3,053 | 43.35 | +2.65 | ||
| Labour hold | Swing | +9.85 | |||
| Labour gain from Conservative | Swing | +8.37 | |||
St Peter's and North Laine

| Party | Candidate | Votes | % | ±% | |
|---|---|---|---|---|---|
| Green | Lizzie Deane | 3,407 | 22.41 | +3.21 | |
| Green | Ian Davey | 3,132 | 20.02 | +2.52 | |
| Green | Pete West | 3,043 | 19.45 | +1.85 | |
| Labour | Clare Calder | 1,326 | 8.48 | +0.32 | |
| Labour | James Hallwood | 1,148 | 7.34 | -0.34 | |
| Labour | Peter Gillman | 1,137 | 7.27 | -0.09 | |
| Conservative | Mike Long | 490 | 3.13 | -1.08 | |
| Conservative | Joseph Tansey | 481 | 3.07 | -1.09 | |
| Conservative | Patrick Ward | 480 | 3.07 | -0.63 | |
| Liberal Democrats | David Sears | 316 | 2.02 | -1.08 | |
| Liberal Democrats | William Parker | 240 | 1.53 | -0.85 | |
| Liberal Democrats | Graham Hunnable | 231 | 1.48 | -1.10 | |
| UKIP | Sabiha Choudhury | 134 | 0.86 | N/A | |
| Independent | Gerald O'Brien | 81 | 0.52 | N/A | |
| Turnout | 5,508 | 41.40 | +7.28 | ||
| Green hold | Swing | +2.89 | |||
| Green hold | Swing | +2.54 | |||
| Green hold | Swing | +2.26 | |||
Westbourne

| Party | Candidate | Votes | % | ±% | |
|---|---|---|---|---|---|
| Conservative | Brian Oxley | 1,228 | 19.74 | -6.93 | |
| Conservative | Denise Cobb | 1,152 | 18.51 | -7.62 | |
| Labour | Simon Battle | 1,020 | 16.39 | +4.38 | |
| Green | Louisa Greenbaum | 911 | 14.64 | +6.58 | |
| Labour | Jacqueline Teeboon | 807 | 12.97 | +3.22 | |
| Green | Ray Cunningham | 615 | 9.88 | +1.82 | |
| Liberal Democrats | June Batchelor | 264 | 4.24 | -0.56 | |
| Liberal Democrats | Coreen Sears | 186 | 2.99 | +0.46 | |
| The European Citizens Party | Susan Collard | 39 | 0.64 | N/A | |
| Turnout | 3,388 | 45.52 | +6.66 | ||
| Conservative hold | Swing | -11.31 | |||
| Conservative hold | Swing | -12.51 | |||
Wish

| Party | Candidate | Votes | % | ±% | |
|---|---|---|---|---|---|
| Labour | Anne Pissaridou | 1,348 | 19.95 | +6.84 | |
| Conservative | Garry Dunn | 1,310 | 19.38 | -6.32 | |
| Conservative | Ted Kemble | 1,183 | 17.51 | -7.01 | |
| Labour | Christine Robinson | 1,144 | 16.93 | +4.03 | |
| Green | Sue Baumgardt | 540 | 7.99 | +0.62 | |
| Independent | Jenny Barnard-Langston | 301 | 4.45 | N/A | |
| Green | Anton Simanowitz | 299 | 4.42 | +0.06 | |
| Independent | Mark Barnard | 244 | 3.61 | N/A | |
| Liberal Democrats | Bob Bailey | 170 | 2.52 | -1.81 | |
| Liberal Democrats | Daniel Russell | 119 | 1.76 | -2.27 | |
| UKIP | Richard Allden | 100 | 1.48 | N/A | |
| Turnout | 3,572 | 51.10 | +4.52 | ||
| Labour gain from Conservative | Swing | +13.85 | |||
| Conservative hold | Swing | -10.14 | |||
Withdean

| Party | Candidate | Votes | % | ±% | |
|---|---|---|---|---|---|
| Green | Sue Shanks | 2,184 | 13.86 | +8.51 | |
| Conservative | Ann Norman | 2,105 | 13.35 | -2.01 | |
| Conservative | Ken Norman | 1,992 | 12.64 | -2.26 | |
| Conservative | Robert Németh | 1,891 | 12.00 | -3.57 | |
| Green | Paul Philo | 1,810 | 11.48 | +6.51 | |
| Green | Jacqui Cuff | 1,672 | 10.61 | +6.83 | |
| Labour | Caraline Brown | 1,222 | 7.75 | +2.17 | |
| Labour | Susan Darby | 1,164 | 7.38 | +1.96 | |
| Labour | Fraser Kemp | 983 | 6.24 | +1.10 | |
| Liberal Democrats | John Lovatt | 309 | 1.96 | -1.27 | |
| Liberal Democrats | Robert Stockman | 218 | 1.38 | -1.48 | |
| Liberal Democrats | Hyder Khalil | 213 | 1.35 | -1.33 | |
| Turnout | 5,447 | 50.95 | +7.27 | ||
| Green gain from Conservative | Swing | +12.08 | |||
| Conservative hold | Swing | -7.04 | |||
| Conservative hold | Swing | -4.59 | |||
Woodingdean

| Party | Candidate | Votes | % | ±% | |
|---|---|---|---|---|---|
| Conservative | Dee Simson | 1,619 | 27.80 | -5.35 | |
| Conservative | Geoff Wells | 1,565 | 26.87 | -6.22 | |
| Labour | Susan Burns | 853 | 14.65 | +4.78 | |
| Labour | Julian Hayes | 756 | 13.14 | +4.11 | |
| Green | Andrea Finch | 403 | 6.92 | +2.95 | |
| Green | Karen James | 259 | 4.45 | +1.00 | |
| UKIP | Graham Townsend | 159 | 2.73 | N/A | |
| Liberal Democrats | Christine-Reba Edge | 121 | 2.08 | -2.18 | |
| Liberal Democrats | Anthony Eke | 89 | 1.53 | -1.64 | |
| Turnout | 3,149 | 42.73 | +3.89 | ||
| Conservative hold | Swing | -10.13 | |||
| Conservative hold | Swing | -10.33 | |||
References
- Ridgway, Tim (8 May 2011). "Updated: Greens triumph in Brighton and Hove". The Argus. Retrieved 21 July 2011.
- "Election candidates 2011". Brighton & Hove Council. 4 April 2011. Retrieved 9 April 2011.
- "Labour are not looking for coalition with Greens". News From Brighton. Archived from the original on 17 July 2011. Retrieved 21 July 2011.
- "UK's first Green council administration announced". Brighton and Hove Green Party. Archived from the original on 15 August 2011. Retrieved 21 July 2011.
- "Councillor goes it alone in elections". The Argus. 10 March 2003. Archived from the original on 2 April 2015. Retrieved 10 March 2015.
External links
| East Sussex County Council | |
|---|---|
| Brighton and Hove City Council | |
| Eastbourne Borough Council | |
| Hastings Borough Council | |
| Lewes District Council | |
| Rother District Council | |
| Wealden District Council | |
| Brighton Borough Council |
|
| Hove Borough Council |
|
| |
City of Brighton and Hove | |||||||||||||
|---|---|---|---|---|---|---|---|---|---|---|---|---|---|
| Topics | |||||||||||||
| Events | |||||||||||||
| Culture | |||||||||||||
| Politics | |||||||||||||
| Transport |
| ||||||||||||
| Media | |||||||||||||
| Sport |
| ||||||||||||
| Buildings | |||||||||||||
| Parks | |||||||||||||
| Areas |
| ||||||||||||
| |||||||||||||