2016 Stevenage Borough Council election
The 2016 Stevenage Borough Council election took place on 5 May 2016 to elect members of Stevenage Borough Council in England.[2] This was on the same day as other local elections. One third of the council was up for election; the seats which were last contested in 2012. The Labour Party retained control of the council, which it had held continuously since 1973.
| |||||||||||||||||||||||||||||||||
13 of the 39 seats to Stevenage Borough Council 20 seats needed for a majority | |||||||||||||||||||||||||||||||||
|---|---|---|---|---|---|---|---|---|---|---|---|---|---|---|---|---|---|---|---|---|---|---|---|---|---|---|---|---|---|---|---|---|---|
| Turnout | 34.65% | ||||||||||||||||||||||||||||||||
| |||||||||||||||||||||||||||||||||
 Map showing the results of contested wards in the 2016 Stevenage Borough Council elections. Labour in red, Conservatives in blue and Liberal Democrats in yellow. | |||||||||||||||||||||||||||||||||
| |||||||||||||||||||||||||||||||||
Results
| Stevenage Borough Council election, 2016[3] | ||||||||
|---|---|---|---|---|---|---|---|---|
| Party | Seats | Popular vote | ||||||
| Won | Not up | Total | ± | Votes | % | ± | ||
| Labour | 10 | 19 | 29 | −1 | 9,155 | 42.6 | ||
| Conservative | 2 | 5 | 7 | +1 | 6,776 | 31.5 | ||
| Liberal Democrats | 1 | 2 | 3 | 0 | 2,706 | 12.6 | ||
| Green | 0 | 0 | 0 | 0 | 1,081 | 5.0 | ||
| UKIP | 0 | 0 | 0 | 0 | 1,038 | 4.8 | ||
| TUSC | 0 | 0 | 0 | 0 | 707 | 3.3 | ||
| Give Me Back Elmo | 0 | 0 | 0 | 0 | 23 | 0.1 | ||
| Total | 13 | 26 | 39 | – | 21486 | – | – | |
| Turnout | 34.65 | |||||||
Ward Results
Bandley Hill

Location of Bandley Hill ward
| Party | Candidate | Votes | % | |
|---|---|---|---|---|
| Labour | Michelle Gardner | 783 | ||
| Conservative | Alexander Farquharson | 603 | ||
| Liberal Democrats | Barbara Segadelli | 98 | ||
| TUSC | Mark Pickersgill | 96 | ||
| Majority | ||||
| Turnout | 32.11% | |||
| Labour hold | ||||
Bedwell

Location of Bedwell ward
| Party | Candidate | Votes | % | |
|---|---|---|---|---|
| Labour | David Cullen | 917 | ||
| Conservative | David William Bundy | 415 | ||
| Green | Victoria Louise Snelling | 147 | ||
| Liberal Democrats | Gareth Steiner | 95 | ||
| TUSC | Steve Glennon | 68 | ||
| Majority | ||||
| Turnout | 33.15% | |||
| Labour hold | ||||
Chells

Location of Chells ward
| Party | Candidate | Votes | % | |
|---|---|---|---|---|
| Labour | Jackie Hollywell | 619 | ||
| Conservative | Matthew Wyatt | 437 | ||
| Liberal Democrats | Stephen Booth | 515 | ||
| TUSC | Roger Alexander Charles | 67 | ||
| Green | Shirley Anne Hicks | 61 | ||
| Give Me Back Elmo | Bobby Smith | 23 | ||
| Majority | ||||
| Turnout | 34.66% | |||
| Labour hold | ||||
Longmeadow
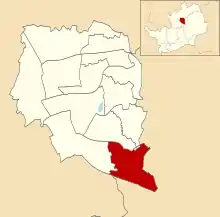
Location of Longmeadow ward
| Party | Candidate | Votes | % | ||
|---|---|---|---|---|---|
| Conservative | Adam Joseph Stephen Mitchell | 638 | |||
| Labour | Lorraine Kathleen Bell | 631 | |||
| Liberal Democrats | Ralph Baskerville | 131 | |||
| Green | Alex Tasker | 98 | |||
| TUSC | Helen Dorothy Kerr | 65 | |||
| Majority | |||||
| Turnout | 35.78% | ||||
| Conservative gain from Labour | Swing | ||||
Manor

Location of Manor ward
| Party | Candidate | Votes | % | |
|---|---|---|---|---|
| Liberal Democrats | Graham Snell | 1,224 | ||
| Conservative | Matthew Clarke | 414 | ||
| Labour | Monika Elizabeth Cherney-Craw | 352 | ||
| Green | Marcus Michael Grant Blackburn | 83 | ||
| Majority | ||||
| Turnout | 42.2% | |||
| Liberal Democrats hold | ||||
Martins Wood

Location of Martins Wood ward
| Party | Candidate | Votes | % | |
|---|---|---|---|---|
| Labour | Maureen McKay | 717 | ||
| Conservative | Michael Steven Hearn | 534 | ||
| Green | Naomi Ruth Collins | 89 | ||
| Liberal Democrats | Andrew David Anderson | 79 | ||
| TUSC | Mark Nathan Simon Gentleman | 56 | ||
| Majority | ||||
| Turnout | 32.56% | |||
| Labour hold | ||||
Old Town

Location of Old Town ward
| Party | Candidate | Votes | % | |
|---|---|---|---|---|
| Labour | Jim Brown | 974 | ||
| Conservative | Philip Kenneth Roethenbaugh | 749 | ||
| Green | Elizabeth Sturges | 143 | ||
| Liberal Democrats | Matthew Snell | 97 | ||
| Majority | ||||
| Turnout | 37.66% | |||
| Labour hold | ||||
Pin Green

Location of Pin Green ward
| Party | Candidate | Votes | % | |
|---|---|---|---|---|
| Labour | Simon Speller | 762 | ||
| Conservative | Michelle Mary Frith | 477 | ||
| Green | Vicky Lovelace | 130 | ||
| Liberal Democrats | Patricia Washer | 99 | ||
| TUSC | Ella Milner | 58 | ||
| Majority | ||||
| Turnout | 33.16% | |||
| Labour hold | ||||
Roebuck

Location of Roebuck ward
| Party | Candidate | Votes | % | |
|---|---|---|---|---|
| Labour | John Lloyd | 714 | ||
| Conservative | Bret Ray Facey | 471 | ||
| UKIP | Mark Peter Williams | 282 | ||
| Green | Martin John Malocco | 86 | ||
| Liberal Democrats | Denise Baskerville | 77 | ||
| TUSC | Bryan Clare | 16 | ||
| Majority | ||||
| Turnout | 34.05% | |||
| Labour hold | ||||
St Nicholas

Location of St Nicholas ward
| Party | Candidate | Votes | % | |
|---|---|---|---|---|
| Labour | Richard Henry | 858 | ||
| Conservative | Kevin Orral | 540 | ||
| Liberal Democrats | Heather Snell | 148 | ||
| Majority | ||||
| Turnout | 33.35% | |||
| Labour hold | ||||
Shephall

Location of Shephall ward
| Party | Candidate | Votes | % | |
|---|---|---|---|---|
| Labour | John Philip Mead | 708 | ||
| Conservative | Ian Frith | 381 | ||
| Green | Michael Andrew Malocco | 133 | ||
| TUSC | Barbara Clare | 111 | ||
| Majority | ||||
| Turnout | 29.57% | |||
| Labour hold | ||||
Symonds Green

Location of Symonds Green ward
| Party | Candidate | Votes | % | |
|---|---|---|---|---|
| Labour | Laurie Chester | 733 | ||
| Conservative | Alex Young | 457 | ||
| UKIP | Sean Ulick Howlett | 252 | ||
| Liberal Democrats | Clive Hearmon | 69 | ||
| Green | Richard David Warr | 57 | ||
| TUSC | Trevor Michael Palmer | 16 | ||
| Majority | ||||
| Turnout | 36.35% | |||
| Labour hold | ||||
Woodfield

Location of Woodfield ward
| Party | Candidate | Votes | % | |
|---|---|---|---|---|
| Conservative | Margaret Notley | 660 | ||
| Labour | Jim Callaghan | 441 | ||
| Liberal Democrats | Daniel Peter Charles Snell | 74 | ||
| Majority | ||||
| Turnout | 34.9% | |||
| Conservative hold | ||||
References
- Steven Ayres (19 May 2016). "Local elections 2016" (PDF). House of Commons Library. p. 23.
- "Guide to May 2016 elections in Scotland, Wales, England and Northern Ireland". BBC News. Retrieved 21 April 2016.
- "Local election: Stevenage Borough Council results". Hertfordshire Mercury. 5 May 2016. Retrieved 6 May 2016.
- "Stevenage Borough Council Local Election Results". Stevenage Borough Council. 6 May 2016. Retrieved 11 May 2019.
This article is issued from Wikipedia. The text is licensed under Creative Commons - Attribution - Sharealike. Additional terms may apply for the media files.