Demographics of Slovakia
This article is about the demographic features of the population of Slovakia, including population density, ethnicity, education level, health of the populace, economic status, religious affiliations and other aspects of the population. The demographic statistics are from the Statistical Office of the SR, unless otherwise indicated.


| Year | Pop. | ±% |
|---|---|---|
| 1848 | 2,442,000 | — |
| 1869 | 2,481,811 | +1.6% |
| 1880 | 2,477,521 | −0.2% |
| 1890 | 2,595,180 | +4.7% |
| 1900 | 2,782,925 | +7.2% |
| 1910 | 2,916,657 | +4.8% |
| 1921 | 2,993,859 | +2.6% |
| 1930 | 3,324,111 | +11.0% |
| 1946 | 3,327,803 | +0.1% |
| 1950 | 3,442,317 | +3.4% |
| 1961 | 4,174,046 | +21.3% |
| 1970 | 4,537,290 | +8.7% |
| 1980 | 4,991,168 | +10.0% |
| 1991 | 5,274,335 | +5.7% |
| 2001 | 5,379,455 | +2.0% |
| 2011 | 5,397,036 | +0.3% |
| 2021 | 5,449,270 | +1.0% |
| Source: | ||
Population
Total population: 5,453,014[1][2] (as of 2018).
Population censuses in 1848–2011
| Census Date | Population | Population Density (per km2) |
|---|---|---|
| 1848-12-31 | 2,442,000 (est.) | 50 |
| 1869-12-31 | 2,481,811 | 51 |
| 1880-12-31 | 2,477,521 | 51 |
| 1890-12-31 | 2,595,180 | 53 |
| 1900-12-31 | 2,782,925 | 57 |
| 1910-12-31 | 2,916,657 | 60 |
| 1921-02-15 | 2,993,859 | 61 |
| 1930-12-01 | 3,324,111 | 68 |
| 1946-10-04 | 3,327,803 | 68 |
| 1950-03-01 | 3,442,317 | 70 |
| 1961-03-01 | 4,174,046 | 85 |
| 1970-12-01 | 4,537,290 | 93 |
| 1980-11-01 | 4,991,168 | 102 |
| 1991-03-03 | 5,274,335 | 108 |
| 2001-05-26 | 5,379,455 | 110 |
| 2011-05-21 | 5,397,036 | 110 |
| 2021-06-13 | 5,449,270 | 111 |
Total Fertility Rate from 1876 to 1918
The total fertility rate is the number of children born per woman. It is based on fairly good data for the entire period. Sources: Our World In Data and Gapminder Foundation.[3]
| Years | 1876 | 1877 | 1878 | 1879 | 1880 | 1881 | 1882 | 1883 | 1884 | 1885 | 1886 | 1887 | 1888 | 1889 | 1890[3] |
|---|---|---|---|---|---|---|---|---|---|---|---|---|---|---|---|
| Total Fertility Rate in Slovakia | 5.96 | 5.96 | 5.92 | 5.87 | 5.83 | 5.78 | 5.74 | 5.77 | 5.8 | 5.83 | 5.86 | 5.9 | 5.83 | 5.76 | 5.7 |
| Years | 1891 | 1892 | 1893 | 1894 | 1895 | 1896 | 1897 | 1898 | 1899 | 1900[3] |
|---|---|---|---|---|---|---|---|---|---|---|
| Total Fertility Rate in Slovakia | 5.63 | 5.56 | 5.54 | 5.52 | 5.5 | 5.49 | 5.47 | 5.42 | 5.37 | 5.31 |
| Years | 1901 | 1902 | 1903 | 1904 | 1905 | 1906 | 1907 | 1908 | 1909 | 1910[3] |
|---|---|---|---|---|---|---|---|---|---|---|
| Total Fertility Rate in Slovakia | 5.26 | 5.21 | 5.16 | 5.1 | 5.04 | 4.99 | 4.93 | 4.86 | 4.78 | 4.71 |
| Years | 1911 | 1912 | 1913 | 1914 | 1915 | 1916 | 1917 | 1918[3] |
|---|---|---|---|---|---|---|---|---|
| Total Fertility Rate in Slovakia | 4.63 | 4.56 | 4.13 | 3.7 | 3.28 | 2.85 | 2.43 | 3.03 |
Vital statistics

|
1.5 - 1.7
1.4 - 1.5
1.3 - 1.4
< 1.3 |
Births and deaths since 1919
| Average population |
Live births | Deaths | Natural change |
Births (per 1000) |
Deaths (per 1000) |
Natural change (per 1000) |
Fertility rates |
Induced abortions | |
|---|---|---|---|---|---|---|---|---|---|
| 1919 | 2,940,000 | 91,729 | 56,866 | 34,863 | 31.2 | 19.3 | 11.9 | 3.64 | |
| 1920 | 3,001,000 | 97,680 | 61,084 | 36,596 | 32.6 | 20.4 | 12.2 | 4.25 | |
| 1921 | 3,006,000 | 114,947 | 63,507 | 51,440 | 38.2 | 21.1 | 17.1 | 4.96 | |
| 1922 | 3,046,000 | 111,059 | 62,902 | 48,157 | 36.5 | 20.7 | 15.8 | 4.67 | |
| 1923 | 3,095,000 | 111,070 | 54,176 | 56,894 | 35.9 | 17.5 | 18.4 | 4.55 | |
| 1924 | 3,135,000 | 106,062 | 56,322 | 49,740 | 33.8 | 18.0 | 15.9 | 4.25 | |
| 1925 | 3,168,000 | 102,867 | 56,171 | 46,696 | 32.5 | 17.7 | 14.7 | 4.01 | |
| 1926 | 3,202,000 | 103,955 | 59,701 | 44,254 | 32.5 | 18.6 | 13.8 | 3.98 | |
| 1927 | 3,232,000 | 99,891 | 59,172 | 40,719 | 30.9 | 18.3 | 12.6 | 3.76 | |
| 1928 | 3,258,000 | 99,673 | 58,320 | 41,353 | 30.6 | 17.9 | 12.7 | 3.69 | |
| 1929 | 3,286,000 | 95,387 | 56,447 | 38,940 | 29.0 | 17.2 | 11.9 | 3.48 | |
| 1930 | 3,315,000 | 96,898 | 52,268 | 44,630 | 29.2 | 15.8 | 13.5 | 3.49 | |
| 1931 | 3,350,000 | 93,309 | 54,273 | 39,036 | 27.9 | 16.2 | 11.7 | 3.33 | |
| 1932 | 3,388,000 | 93,140 | 52,992 | 40,148 | 27.5 | 15.6 | 11.9 | 3.29 | |
| 1933 | 3,424,000 | 84,975 | 50,655 | 34,320 | 24.8 | 14.8 | 10.0 | 2.96 | |
| 1934 | 3,456,000 | 83,493 | 50,178 | 33,315 | 24.2 | 14.5 | 9.6 | 2.86 | |
| 1935 | 3,486,000 | 82,382 | 49,830 | 32,552 | 23.6 | 14.3 | 9.3 | 2.8 | |
| 1936 | 3,515,000 | 80,923 | 48,547 | 32,376 | 23.0 | 13.8 | 9.2 | 2.79 | |
| 1937 | 3,540,000 | 79,862 | 49,527 | 30,335 | 22.6 | 14.0 | 8.6 | 2.77 | |
| 1938 | 3,726,000 | 80,800 | 49,700 | 31,100 | 21.7 | 13.3 | 8.3 | 2.8 | |
| 1939 | 3,577,000 | 81,200 | 48,800 | 32,400 | 22.7 | 13.6 | 9.1 | 2.83 | |
| 1940 | 3,553,000 | 85,300 | 52,900 | 32,400 | 24.0 | 14.9 | 9.1 | 2.87 | |
| 1941 | 3,542,000 | 85,700 | 53,600 | 32,100 | 24.2 | 15.1 | 9.1 | 2.9 | |
| 1942 | 3,523,000 | 87,200 | 55,900 | 31,300 | 24.8 | 15.9 | 8.9 | 2.93 | |
| 1943 | 3,503,000 | 87,700 | 50,900 | 36,800 | 25.0 | 14.5 | 10.5 | 2.96 | |
| 1944 | 3,484,000 | 91,600 | 58,100 | 33,500 | 26.3 | 16.7 | 9.6 | 3 | |
| 1945 | 3,459,000 | 81,880 | 67,505 | 14,375 | 23.7 | 19.5 | 4.2 | 3.03 | |
| 1946 | 3,392,000 | 82,204 | 47,589 | 34,615 | 24.2 | 14.0 | 10.2 | 3.09 | |
| 1947 | 3,399,000 | 87,659 | 41,491 | 46,168 | 25.8 | 12.2 | 13.6 | 3.21 | |
| 1948 | 3,446,000 | 91,189 | 40,873 | 50,316 | 26.5 | 11.9 | 14.6 | 3.24 | |
| 1949 | 3,447,000 | 91,053 | 41,727 | 49,326 | 26.4 | 12.1 | 14.3 | 3.28 | |
| 1950 | 3,463,000 | 99,721 | 39,668 | 60,053 | 28.8 | 11.5 | 17.4 | 3.56 | |
| 1951 | 3,509,000 | 100,663 | 40,505 | 60,158 | 28.5 | 11.5 | 17.0 | 3.58 | |
| 1952 | 3,558,000 | 100,824 | 36,897 | 63,927 | 28.0 | 10.2 | 17.7 | 3.57 | |
| 1953 | 3,599,000 | 99,124 | 35,598 | 63,526 | 26.9 | 9.7 | 17.3 | 3.50 | |
| 1954 | 3,661,000 | 98,310 | 34,866 | 63,444 | 26.2 | 9.3 | 16.9 | 3.45 | |
| 1955 | 3,727,000 | 99,305 | 32,917 | 66,388 | 26.0 | 8.6 | 17.4 | 3.47 | |
| 1956 | 3,787,000 | 99,467 | 32,815 | 66,652 | 25.5 | 8.4 | 17.1 | 3.46 | |
| 1957 | 3,844,000 | 97,311 | 35,755 | 61,556 | 24.5 | 9.0 | 15.5 | 3.34 | |
| 1958 | 3,900,000 | 93,272 | 32,106 | 61,166 | 23.1 | 7.9 | 15.1 | 3.25 | 12,383 |
| 1959 | 3,946,000 | 87,991 | 34,077 | 53,914 | 21.5 | 8.3 | 13.1 | 3.07 | 17,217 |
| 1960 | 3,994,000 | 88,412 | 31,609 | 56,803 | 22.1 | 7.9 | 14.2 | 3.08 | 20,738 |
| 1961 | 4,182,000 | 87,359 | 31,403 | 55,956 | 21.6 | 7.8 | 13.8 | 3.04 | 24,244 |
| 1962 | 4,238,000 | 83,899 | 34,398 | 49,501 | 19.8 | 8.1 | 11.7 | 2.84 | 23,784 |
| 1963 | 4,282,000 | 87,158 | 32,978 | 54,180 | 20.4 | 7.7 | 12.7 | 2.95 | 19,076 |
| 1964 | 4,327,000 | 86,878 | 32,875 | 54,003 | 20.1 | 7.6 | 12.5 | 2.91 | 19,174 |
| 1965 | 4,371,000 | 84,257 | 35,910 | 48,347 | 19.3 | 8.2 | 11.1 | 2.80 | 21,037 |
| 1966 | 4,412,000 | 81,453 | 36,357 | 45,096 | 18.5 | 8.2 | 10.2 | 2.68 | 24,445 |
| 1967 | 4,449,000 | 77,537 | 35,458 | 42,079 | 17.4 | 8.0 | 9.5 | 2.50 | 26,571 |
| 1968 | 4,484,000 | 76,370 | 38,076 | 38,294 | 17.0 | 8.5 | 8.5 | 2.40 | 27,398 |
| 1969 | 4,519,000 | 79,769 | 40,623 | 39,146 | 17.7 | 9.0 | 8.7 | 2.43 | 28,534 |
| 1970 | 4,550,000 | 80,666 | 42,240 | 38,426 | 17.7 | 9.3 | 8.4 | 2.40 | 27,873 |
| 1971 | 4,557,000 | 83,062 | 42,856 | 40,206 | 18.2 | 9.4 | 8.8 | 2.42 | 28,619 |
| 1972 | 4,597,000 | 87,794 | 41,410 | 46,384 | 19.1 | 9.0 | 10.1 | 2.49 | 26,213 |
| 1973 | 4,641,000 | 92,953 | 43,759 | 49,194 | 20.0 | 9.4 | 10.6 | 2.56 | 25,335 |
| 1974 | 4,690,000 | 97,585 | 44,934 | 52,651 | 20.8 | 9.6 | 11.2 | 2.60 | 26,086 |
| 1975 | 4,739,000 | 97,649 | 45,248 | 52,401 | 20.6 | 9.5 | 11.1 | 2.53 | 26,160 |
| 1976 | 4,790,000 | 99,814 | 45,420 | 54,394 | 20.8 | 9.5 | 11.4 | 2.52 | 27,700 |
| 1977 | 4,841,000 | 99,533 | 47,181 | 52,352 | 20.6 | 9.7 | 10.8 | 2.47 | 27,875 |
| 1978 | 4,890,000 | 100,193 | 47,778 | 52,415 | 20.5 | 9.8 | 10.7 | 2.45 | 28,641 |
| 1979 | 4,939,000 | 100,240 | 47,837 | 52,403 | 20.3 | 9.7 | 10.6 | 2.44 | 29,981 |
| 1980 | 4,984,000 | 95,100 | 50,579 | 44,521 | 19.1 | 10.1 | 8.9 | 2.31 | 31,240 |
| 1981 | 5,016,000 | 93,290 | 49,632 | 43,658 | 18.6 | 9.9 | 8.7 | 2.28 | 31,943 |
| 1982 | 5,055,000 | 92,618 | 50,393 | 42,225 | 18.3 | 10.0 | 8.4 | 2.26 | 33,107 |
| 1983 | 5,092,000 | 92,053 | 52,433 | 39,620 | 18.1 | 10.3 | 7.8 | 2.27 | 33,625 |
| 1984 | 5,127,000 | 90,843 | 51,739 | 39,104 | 17.7 | 10.1 | 7.6 | 2.25 | 34,268 |
| 1985 | 5,162,000 | 90,155 | 52,464 | 37,691 | 17.5 | 10.2 | 7.3 | 2.26 | 36,283 |
| 1986 | 5,193,000 | 87,138 | 53,233 | 33,905 | 16.8 | 10.3 | 6.5 | 2.20 | 40,624 |
| 1987 | 5,224,000 | 84,006 | 52,980 | 31,026 | 16.1 | 10.1 | 5.9 | 2.18 | 49,690 |
| 1988 | 5,251,000 | 83,242 | 52,475 | 30,767 | 15.9 | 10.0 | 5.9 | 2.15 | 51,000 |
| 1989 | 5,276,000 | 80,116 | 53,902 | 26,214 | 15.2 | 10.2 | 5.0 | 2.08 | 48,602 |
| 1990 | 5,298,000 | 79,989 | 54,619 | 25,370 | 15.1 | 10.3 | 4.8 | 2.09 | 48,437 |
| 1991 | 5,283,000 | 78,569 | 54,618 | 23,951 | 14.9 | 10.3 | 4.5 | 2.05 | 45,902 |
| 1992 | 5,307,000 | 74,640 | 53,423 | 21,217 | 14.1 | 10.1 | 4.0 | 1.99 | 42,626 |
| 1993 | 5,325,000 | 73,256 | 52,707 | 20,549 | 13.8 | 9.9 | 3.9 | 1.93 | 38,815 |
| 1994 | 5,347,000 | 66,370 | 51,386 | 14,984 | 12.4 | 9.6 | 2.8 | 1.67 | 34,883 |
| 1995 | 5,364,000 | 61,427 | 52,686 | 8,741 | 11.5 | 9.8 | 1.6 | 1.52 | 29,409 |
| 1996 | 5,374,000 | 60,123 | 51,236 | 8,887 | 11.2 | 9.5 | 1.7 | 1.47 | 25,173 |
| 1997 | 5,383,000 | 59,310 | 52,080 | 7,230 | 11.0 | 9.7 | 1.3 | 1.43 | 22,318 |
| 1998 | 5,391,000 | 57,582 | 53,156 | 4,426 | 10.7 | 9.9 | 0.8 | 1.37 | 21,109 |
| 1999 | 5,396,000 | 56,223 | 52,402 | 3,821 | 10.4 | 9.7 | 0.7 | 1.33 | 19,949 |
| 2000 | 5,401,000 | 55,151 | 52,724 | 2,427 | 10.2 | 9.8 | 0.4 | 1.29 | 18,468 |
| 2001 | 5,379,000 | 51,136 | 51,980 | -844 | 9.5 | 9.7 | -0.2 | 1.20 | 18,026 |
| 2002 | 5,379,000 | 50,841 | 51,532 | -691 | 9.5 | 9.6 | -0.1 | 1.19 | 17,382 |
| 2003 | 5,379,000 | 51,713 | 52,230 | -517 | 9.6 | 9.7 | -0.1 | 1.20 | 16,222 |
| 2004 | 5,383,000 | 53,747 | 51,852 | 1,895 | 10.0 | 9.6 | 0.4 | 1.24 | 15,307 |
| 2005 | 5,387,000 | 54,430 | 53,475 | 955 | 10.1 | 9.9 | 0.2 | 1.25 | 14,427 |
| 2006 | 5,391,000 | 53,904 | 53,301 | 603 | 10.0 | 9.9 | 0.1 | 1.24 | 14,243 |
| 2007 | 5,398,000 | 54,424 | 53,856 | 568 | 10.1 | 10.0 | 0.1 | 1.26 | 13,424 |
| 2008 | 5,407,000 | 57,360 | 53,164 | 4,196 | 10.6 | 9.8 | 0.8 | 1.32 | 13,394 |
| 2009 | 5,418,000 | 61,217 | 52,913 | 8,304 | 11.3 | 9.8 | 1.5 | 1.41 | 13,240 |
| 2010 | 5,431,000 | 60,410 | 53,445 | 6,965 | 11.1 | 9.8 | 1.3 | 1.40 | 12,582 |
| 2011 | 5,398,000 | 60,813 | 51,903 | 8,910 | 11.3 | 9.6 | 1.7 | 1.45 | 11,789 |
| 2012 | 5,408,000 | 55,535 | 52,437 | 3,098 | 10.3 | 9.7 | 0.6 | 1.34 | 11,214 |
| 2013 | 5,416,000 | 54,823 | 52,089 | 2,734 | 10.1 | 9.6 | 0.5 | 1.34 | 11,105 |
| 2014 | 5,421,000 | 55,033 | 51,346 | 3,687 | 10.2 | 9.5 | 0.7 | 1.37 | 10,582 |
| 2015 | 5,426,000 | 55,604 | 53,826 | 1,778 | 10.3 | 9.9 | 0.4 | 1.40 | 10,058 |
| 2016 | 5,435,000 | 57,557 | 52,351 | 5,206 | 10.6 | 9.6 | 1.0 | 1.48 | 9,390 |
| 2017[4][5] | 5,443,000 | 57,969 | 53,914 | 4,055 | 10.7 | 9.9 | 0.8 | 1.52 | 9,083 |
| 2018 | 5,450,000 | 57,639 | 54,293 | 3,346 | 10.6 | 10.0 | 0.6 | 1.54 | 9,039 |
| 2019 | 5,458,000 | 57,054 | 53,234 | 3,820 | 10.5 | 9.8 | 0.7 | 1.56 | 6,682 |
| 2020 [6] | 5,459,781 | 56,650 | 59,089 | -2,439 | 10.4 | 10.8 | -0.4 | 1.59 | 6,180 |
| 2021 | 5,449,270 | 56,565 | 73,461 | -16,896 | 10.4 | 13.5 | -3.1 | 1.64 | |
| 2022 | 5,434,712 | ||||||||
Current vital statistics
| Period | Live births | Deaths | Natural increase |
|---|---|---|---|
| January - February 2021 | 9,068 | 17,121 | -8,053 |
| January - February 2022 | 8,298 | 10,780 | -2,482 |
| Difference |
- Deaths for January - February 2021 =
 16,219
 - Deaths for January - February 2022 =
 9,889
9,889
Other demographics statistics
Demographic statistics according to the World Population Review in 2021.[8]
- One birth every 10 minutes
- One death every 9 minutes
- One net migrant every 480 minutes
- Net gain of one person every 1440 minutes
The following demographic statistics are from the CIA World Factbook.[9]
Population
- 5,436,066 (July 2021 est.)
Age structure

- 0-14 years: 15.13% (male 423,180 /female 400,128)
- 15-24 years: 10.06% (male 280,284 /female 266,838)
- 25-54 years: 44.61% (male 1,228,462 /female 1,198,747)
- 55-64 years: 13.15% (male 342,142 /female 373,452)
- 65 years and over: 17.05% (male 366,267 /female 561,120) (2020 est.)
- 0–14 years: 15.6% (male 437,755; female 417,797)
- 15–64 years: 71.6% (male 1,955,031; female 1,965,554)
- 65 years and over: 12.8% (male 262,363; female 438,538 (2011 est)
Median age
- total: 41.8 years. Country comparison to the world: 41th
- male: 40.1 years
- female: 43.6 years (2020 est.)
- total: 38 years
- male: 36.5 years
- female: 39.5 years (2012 est)
Birth rate

- 9.1 births/1,000 population (2021 est.) Country comparison to the world: 203th
Death rate
- 10.08 deaths/1,000 population (2021 est.) Country comparison to the world: 34th
Total fertility rate
- 1.45 children born/woman (2021 est.) Country comparison to the world: 211th
Net migration rate
- 0.2 migrant(s)/1,000 population (2021 est.) Country comparison to the world: 75rd
Population growth rate
- -0.08% (2021 est.) Country comparison to the world: 202th
Mother's mean age at first birth
- 27.2 years (2019 est.)
Life expectancy at birth
- total population: 78.07 years
- male: 74.56 years
- female: 81.82 years (2021 est.)
Dependency ratios
- total dependency ratio: 47.6
- youth dependency ratio: 23
- elderly dependency ratio: 24.6
- potential support ratio: 4.1 (2020 est.)
Ethnic groups
Slovak 83.82%, Hungarian 7.75%, Romani 1.23%, other 0.68% (includes Czech, Rusyn, Ukrainian, Russian, German, Polish), unspecified 5.42% (2021 census)
Languages
Slovak (official) 81.77%, Hungarian 8.48%, Roma 1.84%, Rusyn 0.71%, other or unspecified 7.2% (2021 census)
Religions
Roman Catholic 55.76%, Protestant 5.27%, Greek Catholic 4%, other or unspecified 11.18%, none 23.79% (2021 census)
School life expectancy (primary to tertiary education)
- total: 15 years
- male: 14 years
- female: 15 years (2018)
Unemployment, youth ages 15–24
- Total: 19.4%. Country comparison to the world: 81th
- Male: 18.3%
- Female: 21.2% (2020 est.)
Sex ratio
at birth:
1.05 male(s)/female
under 15 years:
1.05 male(s)/female
15–64 years:
1 male(s)/female
65 years and over:
0.6 male(s)/female
total population:
0.94 male(s)/female (2011 est.)
Immigration

| Nationality | Population (2020)[10] |
|---|---|
| 42,162 | |
| 16,005 | |
| 12,246 | |
| 9,492 | |
| 7,372 | |
| 6,798 | |
| 6,133 | |
| 5,658 | |
| 4,572 | |
| 3,057 | |
| 2,828 | |
| 2,695 | |
| 2,563 | |
| 1,740 | |
| 1,563 | |
| 1,300 | |
| 1,000 | |
Infant mortality rate
Total: 4.9 deaths/1,000 live births
Male: 5.56 deaths/1,000 live births
Female: 4.2 deaths/1,000 live births (2021 est.)
Life expectancy at birth
Life expectancy from 1950 to 2015 (UN World Population Prospects):[11]
| Period | Life expectancy in Years |
|---|---|
| 1950–1955 | 64.43 |
| 1955–1960 | |
| 1960–1965 | |
| 1965–1970 | |
| 1970–1975 | |
| 1975–1980 | |
| 1980–1985 | |
| 1985–1990 | |
| 1990–1995 | |
| 1995–2000 | |
| 2000–2005 | |
| 2005–2010 | |
| 2010–2015 |
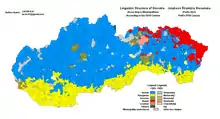

Ethnic groups


The majority of the 5.4 million inhabitants of Slovakia are Slovak (83.82%). Hungarians are the largest ethnic minority (7.75%) and are concentrated in the southern and eastern regions of Slovakia. Other ethnic groups include Roma (1.23%), Czechs, Croats, Rusyns, Ukrainians, Germans, Poles, Gorals, Serbs[12] and Jews (about 2,300 remain of the estimated pre-WWII population of 120,000).
While both international organizations (the United Nations and the World Bank) and the official Slovak statistics office offer population figures for ethnic groups, these figures seldom come close to agreement. Figures for the Roma population (for a variety of reasons) vary between 1% and 10% of the population. In the most recent survey carried out by the Slovak Government's Roma Plenipotentiary, the figure for the percentage of Roma was arrived at through interview with municipality representatives and mayors, according to how many Roma they think live in their jurisdictions. The figure arrived at by this means was in the region of 300,000 (about 5.6%). Note that in the case of the 5.6%, however, the above percentages of Hungarians and Slovaks are lower accordingly.
| Ethnic group |
census 1950 | census 1961 | census 1970 | census 1980 | census 1991 | census 2001 | census 2011 | statistics 2018[15] | census 2021 | |||||||||
|---|---|---|---|---|---|---|---|---|---|---|---|---|---|---|---|---|---|---|
| Number | % | Number | % | Number | % | Number | % | Number | % | Number | % | Number | % | Number | % | Number | % | |
| Slovaks | 86.6 | 85.3 | 85.5 | 4,317,008 | 86.5 | 4,519,328 | 85.7 | 4,614,854 | 85.8 | 4,352,775 | 80.7 | 4,444,758 | 81.5% | 4.567,547 | 83.82 | |||
| Hungarians | 10.3 | 12.4 | 12.2 | 559,490 | 11.2 | 567,296 | 10.8 | 520,528 | 9.7 | 458,467 | 8.5 | 451,914 | 8.3% | 422,065 | 7.75 | |||
| Romani1 | - | - | - | - | - | 75,802 | 1.4 | 89,920 | 1.7 | 105,738 | 2.0 | 111,889 | 2.1% | 67,179 | 1.23 | |||
| Czechs | 1.2 | 1.1 | 1.0 | 57,197 | 1.1 | 59,326 | 1.1 | 44,620 | 0.8 | 30,367 | 0.6 | 37,219 | 0.7% | 28,996 | 0.53 | |||
| Rusyns | 1.4 | - | 0.9 | 36,850 | 0.7 | 17,197 | 0.3 | 24,201 | 0.4 | 33,482 | 0.6 | 30,153 | 0.6% | 23,746 | 0.44 | |||
| Ukrainians | 13,281 | 0.3 | 10,814 | 0.2 | 7,430 | 0.1 | 10,501 | 0.2% | 9,451 | 0.17 | ||||||||
| Others/undeclared | 0.5 | 1.2 | 0.4 | 20,623 | 0.4 | 22,105 | 0.4 | 74,518 | 1.4 | 408,777 | 7.5 | 363,987 | 6.7% | 329,908 | 6.1% | |||
| Total | 3,442,317 | 4,174,046 | 4,537,290 | 4,991,168 | 5,274,335 | 5,379,455 | 5,397,036 | 5,450,421 | 5,449,270 | |||||||||
| 1 Before 1991 the Romani were not recognized as a separate ethnic group | ||||||||||||||||||
The official state language is Slovak, and Hungarian is widely spoken in the southern regions.
Despite its modern European economy and society, Slovakia has a significant rural element. About 45% of Slovaks live in villages with fewer than 5,000 inhabitants, and 14% in villages with fewer than 1,000.
Religion

The Slovak constitution guarantees freedom of religion. The majority of Slovak citizens (55,76%) practice Roman Catholicism; the second-largest group consider themselves atheists (23.79%). About 5.27% are Protestants, 4% are Greek Catholics, and 0.93% are Orthodox and Reformed Christian Church 1.56% (2021 census).
See also
References
- ""World Population prospects – Population division"". population.un.org. United Nations Department of Economic and Social Affairs, Population Division. Retrieved November 9, 2019.
- ""Overall total population" – World Population Prospects: The 2019 Revision" (xslx). population.un.org (custom data acquired via website). United Nations Department of Economic and Social Affairs, Population Division. Retrieved November 9, 2019.
- Max Roser (2014), "Total Fertility Rate around the world over the last centuries", Our World In Data, Gapminder Foundation, archived from the original on 2019-03-09, retrieved 2019-05-02
- "Štatistický úrad SR". Portal.statistics.sk. Retrieved 29 August 2017.
- "Main demographic data". Infostat.sk. Retrieved 29 August 2017.
- "Štatistický úrad SR". Portal.statistics.sk.
- "Population Change".
- "Slovakia Population 2021", World Population Review
- "The World FactBook - Slovakia", The World Factbook, November 19, 2021
 This article incorporates text from this source, which is in the public domain.
 - https://www.minv.sk/swift_data/source/policia/hranicna_a_cudzinecka_policia/rocenky/rok_2020/2020-rocenka-UHCP-EN.pdf
- "World Population Prospects – Population Division – United Nations". Retrieved 2017-07-15.
- "Archived copy". Archived from the original on 2010-09-18. Retrieved 2010-09-18.
{{cite web}}: CS1 maint: archived copy as title (link) - "Demographic data from population and housing censuses in Slovakia". Sodb.infostat.sk. Retrieved 29 August 2017.
- "Development of prices in production area in July 2017" (PDF). Portal.statistics.sk. Archived from the original (PDF) on 15 July 2007. Retrieved 29 August 2017.
- "Bilancia podľa národnosti a pohlavia - SR-oblasť-kraj-okres, m-v [om7002rr]". Statistics of Slovakia (in Slovak). Statistics of Slovakia. Retrieved 28 April 2019.
External links
- "New Page 1". Statistics.sk. Retrieved 29 August 2017.
- "Main demographic data". Infostat.sk. Retrieved 29 August 2017.
- (in Czech) summary of villages in Hungary in 1864 - 1865, PETROV, Alexej Leonidovich. Sborník Fr. Pestyho Helység névtara-Seznam osad v Uhrách z r. 1864-65, : jako pramen historicko-demografických údajů o slovenských a karpatoruských osadách. Praha : Česká akademie věd a umění, 1927. 174 s. - available online at University Library in Bratislava Digital Library

|