Lingig
Lingig, officially the Municipality of Lingig, is a 2nd class municipality in the province of Surigao del Sur, Philippines. According to the 2020 census, it had a population of 35,142 people. [3]
Lingig | |
|---|---|
| Municipality of Lingig | |
 Tagpupuran Blue Waters Resort | |
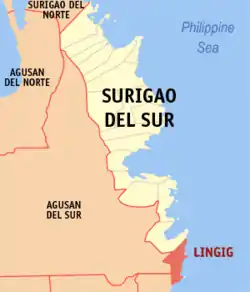 Map of Surigao del Sur with Lingig highlighted | |
OpenStreetMap  | |
.svg.png.webp) Lingig Location within the Philippines | |
| Coordinates: 8°02′17″N 126°24′46″E | |
| Country | Philippines |
| Region | Caraga |
| Province | Surigao del Sur |
| District | 2nd district |
| Barangays | 18 (see Barangays) |
| Government | |
| • Type | Sangguniang Bayan |
| • Mayor | Roberto "Jimmy" M. Luna, Jr. |
| • Vice Mayor | Elmer "Boyet" P. Evangelio |
| • Representative | Johnny T. Pimentel |
| • Electorate | 22,482 voters (2019) |
| Area | |
| • Total | 305.17 km2 (117.83 sq mi) |
| Elevation | 101 m (331 ft) |
| Highest elevation | 1,625 m (5,331 ft) |
| Lowest elevation | 0 m (0 ft) |
| Population | |
| • Total | 35,142 |
| • Density | 120/km2 (300/sq mi) |
| • Households | 6,965 |
| Economy | |
| • Income class | 2nd municipal income class |
| • Poverty incidence | 36.32% (2018)[4] |
| • Revenue | ₱171,073,441.34 (2020) |
| • Assets | ₱261,125,446.89 (2020) |
| • Expenditure | ₱172,788,136.72 (2020) |
| • Liabilities | ₱96,232,581.72 (2020) |
| Service provider | |
| • Electricity | Surigao del Sur 1 Electric Cooperative (SURSECO 1) |
| Time zone | UTC+8 (PST) |
| ZIP code | 8312 |
| PSGC | |
| IDD : area code | +63 (0)86 |
| Native languages | Surigaonon Agusan Cebuano Kamayo Tagalog |
| Website | www |
The municipality is around one and a half hour away from Barangay Mangagoy, Bislig City by bus. Similar to Davao Oriental, it is a border town of Surigao del Sur.
Geography
Barangays
Lingig is politically subdivided into 18 barangays.
- Anibongan
- Barcelona
- Bogak
- Bongan
- Handamayan
- Mahayahay
- Mandus
- Mansa-ilao
- Pagtila-an
- Palo Alto
- Poblacion
- Rajah Cabungso-an
- Sabang
- Salvacion
- San Roque
- Tagpoporan (Tagpupuran)
- Union
- Valencia
Climate
| Climate data for Lingig | |||||||||||||
|---|---|---|---|---|---|---|---|---|---|---|---|---|---|
| Month | Jan | Feb | Mar | Apr | May | Jun | Jul | Aug | Sep | Oct | Nov | Dec | Year |
| Average high °C (°F) | 29.5 (85.1) |
29.5 (85.1) |
30.5 (86.9) |
31.3 (88.3) |
31.7 (89.1) |
31.6 (88.9) |
31.6 (88.9) |
31.9 (89.4) |
32.0 (89.6) |
31.7 (89.1) |
31.1 (88.0) |
30.2 (86.4) |
31.1 (87.9) |
| Daily mean °C (°F) | 25.7 (78.3) |
25.6 (78.1) |
26.3 (79.3) |
26.9 (80.4) |
27.4 (81.3) |
27.2 (81.0) |
27.1 (80.8) |
27.3 (81.1) |
27.3 (81.1) |
27.1 (80.8) |
26.7 (80.1) |
26.2 (79.2) |
26.7 (80.1) |
| Average low °C (°F) | 21.8 (71.2) |
21.8 (71.2) |
22.1 (71.8) |
22.6 (72.7) |
23.1 (73.6) |
22.8 (73.0) |
22.6 (72.7) |
22.7 (72.9) |
22.6 (72.7) |
22.6 (72.7) |
22.4 (72.3) |
22.2 (72.0) |
22.4 (72.4) |
| Average rainfall mm (inches) | 757 (29.8) |
561 (22.1) |
495 (19.5) |
347 (13.7) |
256 (10.1) |
165 (6.5) |
148 (5.8) |
132 (5.2) |
140 (5.5) |
200 (7.9) |
314 (12.4) |
644 (25.4) |
4,159 (163.9) |
| Source: Climate-Data.org[5] | |||||||||||||
Lingig has a tropical rainforest climate (Af) with heavy to very heavy rainfall year-round and with extremely heavy rainfall in January.
Demographics
| Year | Pop. | ±% p.a. |
|---|---|---|
| 1903 | 730 | — |
| 1939 | 5,397 | +5.71% |
| 1948 | 4,462 | −2.09% |
| 1960 | 11,225 | +7.99% |
| 1970 | 13,836 | +2.11% |
| 1975 | 19,172 | +6.76% |
| 1980 | 19,993 | +0.84% |
| 1990 | 21,015 | +0.50% |
| 1995 | 23,477 | +2.10% |
| 2000 | 26,487 | +2.62% |
| 2007 | 28,269 | +0.90% |
| 2010 | 31,544 | +4.07% |
| 2015 | 31,485 | −0.04% |
| 2020 | 35,142 | +2.18% |
| Source: Philippine Statistics Authority [6] [7] [8][9] | ||
Economy
| Poverty Incidence of Lingig | |
| Source: Philippine Statistics Authority[10][11][12][13][14][15][16] | |
References
- Municipality of Lingig | (DILG)
- "2015 Census of Population, Report No. 3 – Population, Land Area, and Population Density" (PDF). Philippine Statistics Authority. Quezon City, Philippines. August 2016. ISSN 0117-1453. Archived (PDF) from the original on May 25, 2021. Retrieved July 16, 2021.
- Census of Population (2020). "Caraga". Total Population by Province, City, Municipality and Barangay. PSA. Retrieved 8 July 2021.
- "PSA Releases the 2018 Municipal and City Level Poverty Estimates". Philippine Statistics Authority. 15 December 2021. Retrieved 22 January 2022.
- "Climate: Lingig". Climate-Data.org. Retrieved 25 October 2020.
- Census of Population (2015). "Caraga". Total Population by Province, City, Municipality and Barangay. PSA. Retrieved 20 June 2016.
- Census of Population and Housing (2010). "Caraga". Total Population by Province, City, Municipality and Barangay. NSO. Retrieved 29 June 2016.
- Censuses of Population (1903–2007). "Caraga". Table 1. Population Enumerated in Various Censuses by Province/Highly Urbanized City: 1903 to 2007. NSO.
- "Province of Surigao del Sur". Municipality Population Data. Local Water Utilities Administration Research Division. Retrieved 17 December 2016.
- "Poverty incidence (PI):". Philippine Statistics Authority. Retrieved 28 December 2020.
- https://psa.gov.ph/sites/default/files/NSCB_LocalPovertyPhilippines_0.pdf; publication date: 29 November 2005; publisher: Philippine Statistics Authority.
- https://psa.gov.ph/sites/default/files/2003%20SAE%20of%20poverty%20%28Full%20Report%29_1.pdf; publication date: 23 March 2009; publisher: Philippine Statistics Authority.
- https://psa.gov.ph/sites/default/files/2006%20and%202009%20City%20and%20Municipal%20Level%20Poverty%20Estimates_0_1.pdf; publication date: 3 August 2012; publisher: Philippine Statistics Authority.
- https://psa.gov.ph/sites/default/files/2012%20Municipal%20and%20City%20Level%20Poverty%20Estima7tes%20Publication%20%281%29.pdf; publication date: 31 May 2016; publisher: Philippine Statistics Authority.
- https://psa.gov.ph/sites/default/files/City%20and%20Municipal-level%20Small%20Area%20Poverty%20Estimates_%202009%2C%202012%20and%202015_0.xlsx; publication date: 10 July 2019; publisher: Philippine Statistics Authority.
- "PSA Releases the 2018 Municipal and City Level Poverty Estimates". Philippine Statistics Authority. 15 December 2021. Retrieved 22 January 2022.
External links
- Lingig Profile at PhilAtlas.com
- Philippine Standard Geographic Code
- Philippine Census Information
- Local Governance Performance Management System
Places adjacent to Lingig | ||||||||||||||||
|---|---|---|---|---|---|---|---|---|---|---|---|---|---|---|---|---|
| ||||||||||||||||
Tandag (capital) | |
| Municipalities | |
| Component cities | |
This article is issued from Wikipedia. The text is licensed under Creative Commons - Attribution - Sharealike. Additional terms may apply for the media files.