Demographics of Zambia
This article is about the demographic features of the population of Zambia, including population density, ethnicity, education level, health of the populace, economic status, religious affiliations and others aspects of the population.

Ethnic groups
Zambia is one of the most highly urbanised countries in sub-Saharan Africa with 44% of the population concentrated in a few urban areas along the major transport corridors, while rural areas are sparsely populated. Zambia's population comprises more than 72 Bantu-speaking ethnic groups. Some ethnic groups are small, and only two have enough people to constitute at least 10% of the population. The majority of Zambians are subsistence farmers, but the country is also fairly urbanised, with 42% of the population being city residents. The predominant religion is a blend of traditional beliefs and Christianity.[1]
Immigrants, mostly British or South African, as well as some white Zambian citizens (about 40,000), live mainly in Lusaka and in the Copperbelt in northern Zambia, where they are either employed in mines, financial and related activities or retired. Zambia also has a small but economically important Asian population, most of whom are Indians or Chinese.[2]
2010 census

| Groups | Percentage |
|---|---|
| African | 99.2% |
| Bemba | 21% |
| Tonga | 13.6% |
| Chewa | 7.4% |
| Lozi | 5.7% |
| Nsenga | 5.3% |
| Tumbuka | 4.4% |
| Ngoni | 4% |
| Lala | 3.1% |
| Kaonde | 2.9% |
| Namwanga | 2.8% |
| Lunda (North-western) | 2.6% |
| Mambwe | 2.5% |
| Luvale | 2.2% |
| Lamba | 2.1% |
| Ushi | 1.9% |
| Lenje | 1.6% |
| Bisa | 1.6% |
| Mbunda | 1.2% |
| Other | 13.8% |
| Unspecified | 0.4% |
Source:[3]
Population
According to the 2019 revision of the World Population Prospects[4][5] the total population of Zambia is 17,351,708 in 2018, compared to only 2,340,000 in 1950. The proportion of children below the age of 15 in 2010 was 46.4%, 50.6% was between 15 and 65 years of age, while 3.1% was 65 years or older.[6]
| Total population[7] | Population aged 0–14 (%) | Population aged 15–64 (%) | Population aged 65+ (%) | |
|---|---|---|---|---|
| 1950 | 2 340 000 | 44.9 | 52.3 | 2.7 |
| 1955 | 2 653 000 | 44.7 | 52.7 | 2.6 |
| 1960 | 3 045 000 | 44.9 | 52.6 | 2.5 |
| 1965 | 3 537 000 | 45.2 | 52.2 | 2.6 |
| 1970 | 4 139 000 | 46.4 | 50.9 | 2.7 |
| 1975 | 4 900 000 | 47.0 | 50.3 | 2.7 |
| 1980 | 5 775 000 | 47.3 | 49.9 | 2.8 |
| 1985 | 6 785 000 | 46.6 | 50.6 | 2.8 |
| 1990 | 7 860 000 | 45.8 | 51.4 | 2.8 |
| 1995 | 8 919 000 | 45.3 | 51.8 | 2.9 |
| 2000 | 10 202 000 | 45.3 | 51.8 | 2.9 |
| 2005 | 11 462 000 | 45.9 | 51.0 | 3.0 |
| 2010 | 13 089 000 | 46.4 | 50.6 | 3.1 |
| 2018 | 17,351,708 |
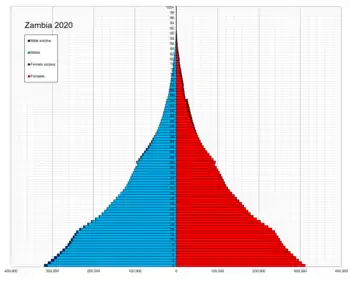
Population Estimates by Sex and Age Group (01.VII.2020): [8]
| Age Group | Male | Female | Total | % |
|---|---|---|---|---|
| Total | 8 852 174 | 9 033 248 | 17 885 422 | 100 |
| 0–4 | 1 579 231 | 1 554 009 | 3 133 240 | 17.52 |
| 5–9 | 1 357 442 | 1 343 776 | 2 701 218 | 15.10 |
| 10–14 | 1 160 256 | 1 154 409 | 2 314 665 | 12.94 |
| 15–19 | 958 687 | 954 923 | 1 913 610 | 10.70 |
| 20–24 | 833 604 | 851 421 | 1 685 025 | 9.42 |
| 25–29 | 693 050 | 727 248 | 1 420 298 | 7.94 |
| 30–34 | 496 336 | 579 946 | 1 076 282 | 6.02 |
| 35–39 | 433 030 | 493 825 | 926 855 | 5.18 |
| 40–44 | 361 566 | 362 160 | 723 726 | 4.05 |
| 45–49 | 298 359 | 283 452 | 581 811 | 3.25 |
| 50–54 | 205 799 | 193 301 | 399 100 | 2.23 |
| 55–59 | 153 109 | 160 905 | 314 014 | 1.76 |
| 60–64 | 109 330 | 123 190 | 232 520 | 1.30 |
| 65-69 | 72 624 | 79 062 | 151 686 | 0.85 |
| 70-74 | 54 288 | 68 013 | 122 301 | 0.68 |
| 75-79 | 35 056 | 44 637 | 79 693 | 0.45 |
| 80+ | 50 407 | 58 971 | 109 378 | 0.61 |
| Age group | Male | Female | Total | Percent |
| 0–14 | 4 096 929 | 4 052 194 | 8 149 123 | 45.56 |
| 15–64 | 4 542 870 | 4 730 371 | 9 273 241 | 51.85 |
| 65+ | 212 375 | 250 683 | 463 058 | 2.59 |
Vital statistics
Registration of vital events is in Zambia not complete. The Population Departement of the United Nations prepared the following estimates. [6]
| Period | Live births per year | Deaths per year | Natural change per year | CBR* | CDR* | NC* | TFR* | IMR* |
|---|---|---|---|---|---|---|---|---|
| 1950-1955 | 117 000 | 54 000 | 63 000 | 46.8 | 21.7 | 25.1 | 6.75 | 148 |
| 1955-1960 | 136 000 | 57 000 | 78 000 | 47.6 | 20.1 | 27.5 | 6.90 | 137 |
| 1960-1965 | 160 000 | 62 000 | 98 000 | 48.6 | 18.8 | 29.8 | 7.15 | 127 |
| 1965-1970 | 189 000 | 68 000 | 121 000 | 49.3 | 17.7 | 31.6 | 7.40 | 118 |
| 1970-1975 | 219 000 | 72 000 | 147 000 | 48.5 | 16.0 | 32.5 | 7.43 | 107 |
| 1975-1980 | 254 000 | 79 000 | 174 000 | 47.5 | 14.9 | 32.6 | 7.38 | 100 |
| 1980-1985 | 283 000 | 91 000 | 192 000 | 45.1 | 14.4 | 30.6 | 6.95 | 99 |
| 1985-1990 | 322 000 | 113 000 | 209 000 | 44.0 | 15.4 | 28.6 | 6.66 | 103 |
| 1990-1995 | 365 000 | 151 000 | 214 000 | 43.5 | 18.0 | 25.5 | 6.30 | 107 |
| 1995-2000 | 427 000 | 187 000 | 240 000 | 44.6 | 19.6 | 25.1 | 6.20 | 105 |
| 2000-2005 | 480 000 | 212 000 | 269 000 | 44.4 | 19.6 | 24.8 | 6.10 | 103 |
| 2005-2010 | 547 000 | 204 000 | 342 000 | 44.5 | 16.7 | 27.9 | 6.20 | 95 |
| * CBR = crude birth rate (per 1000); CDR = crude death rate (per 1000); NC = natural change (per 1000); IMR = infant mortality rate per 1000 births; TFR = total fertility rate (number of children per woman) | ||||||||
Births and deaths[9]
| Year | Population | Live births | Deaths | Natural increase | Crude birth rate | Crude death rate | Rate of natural increase | TFR |
|---|---|---|---|---|---|---|---|---|
| 1980 | 5,661,801 | 37.0 | 7.2 | |||||
| 1990 | 7,383,105 | 44.0 | 6.7 | |||||
| 2000 | 9,337,425 | 36.0 | 6.0 | |||||
| 2010 | 13,092,666 | 442,998 | 164,385 | 278,613 | 35.4 | 13.1 | 22.2 | 5.9 |
Fertility and births
Total Fertility Rate (TFR) (Wanted TFR) and Crude Birth Rate (CBR) :[10] [11]
| Year | CBR Total | TFR (Wanted TFR) Total | CBR Urban | TFR (Wanted TFR) Urban | CBR Rural | TFR (Wanted TFR) Rural |
|---|---|---|---|---|---|---|
| 1992 | 45 | 6.5 (5.4) | 44 | 5.8 (4.7) | 46 | 7.1 (6.2) |
| 1996 | 45.2 | 6.08 (5.2) | 43.7 | 5.08 (4.1) | 46.1 | 6.86 (6.1) |
| 2001-2002 | 43.3 | 5.9 (4.9) | 36.7 | 4.3 (3.4) | 47.0 | 6.9 (5.8) |
| 2007 | 43.6 | 6.2 (5.2) | 36.3 | 4.3 (3.6) | 47.5 | 7.5 (6.3) |
| 2013-2014 | 37.2 | 5.3 (4.5) | 32.2 | 3.7 (3.3) | 40.3 | 6.6 (5.6) |
| 2018 | 35.3 | 4.7 (4.0) | 30.9 | 3.4 (2.9) | 38.4 | 5.8 (5.0) |
Fertility data as of 2013-2014 (DHS Program):[12]
| Province | Total fertility rate | Percentage of women age 15-49 currently pregnant | Mean number of children ever born to women age 40-49 |
|---|---|---|---|
| Central | 5.9 | 8.1 | 6.8 |
| Copperbelt | 4.0 | 7.6 | 5.5 |
| Eastern | 5.8 | 8.7 | 6.9 |
| Luapula | 6.4 | 11.4 | 6.6 |
| Lusaka | 3.7 | 7.7 | 5.1 |
| Muchinga | 6.3 | 10.3 | 7.2 |
| Northern | 6.6 | 10.4 | 7.6 |
| North Western | 6.2 | 9.2 | 6.7 |
| Southern | 6.2 | 9.2 | 6.9 |
| Western | 5.6 | 8.1 | 6.0 |
Fertility rate by religion
At national level, the TFR was highest among women with no religious affiliation at 6.5. Among the women with religious affiliation Protestants had the highest TFR of 6.0, followed by Muslims with 5.9 and Catholics with 5.7.[13][14]
| Religious Affiliation [15] | Total fertility rate |
|---|---|
| Protestantism | 6.0 |
| Catholicism | 5.7 |
| Islam | 5.9 |
| Hinduism | 2.0 |
| Other religions | 5.8 |
| Not religious | 6.5 |
| Zambia (total) | 5.9 |
Life expectancy
| Period | Life expectancy in Years[16] |
|---|---|
| 1950–1955 | 42.07 |
| 1955–1960 | |
| 1960–1965 | |
| 1965–1970 | |
| 1970–1975 | |
| 1975–1980 | |
| 1980–1985 | |
| 1985–1990 | |
| 1990–1995 | |
| 1995–2000 | |
| 2000–2005 | |
| 2005–2010 | |
| 2010–2015 |
Other demographic statistics
The following demographic statistics of Zambia in 2019 are from the World Population Review.[17]
- One birth every 47 seconds
- One death every 4 minutes
- One net migrant every 65 minutes
- Net gain of one person every 1 minutes
The following demographic statistics are from the CIA World Factbook, unless otherwise indicated.[18]
Population
- 16,445,079 (July 2018 est.)
Age structure

- 0-14 years: 45.95% (male 3,796,548 /female 3,759,624)
- 15-24 years: 20% (male 1,643,364 /female 1,645,713)
- 25-54 years: 28.79% (male 2,384,765 /female 2,349,877)
- 55-64 years: 2.95% (male 225,586 /female 260,252)
- 65 years and over: 2.31% (male 166,224 /female 213,126) (2018 est.)
Median age
- total: 16.8 years. Country comparison to the world: 222nd
- male: 16.7 years
- female: 16.9 years (2018 est.)
- total: 17.2 years
- male: 17.1 years
- female: 17.3 years (2010 est.)
- total: 16.46 years
- male: 16.26 years
- female: 16.67 years (2005 est.)
- total: 16.5 years
- male: 16.4 years
- female: 16.6 years (2002 est.)
Birth rate
- 41.1 births/1,000 population (2018 est.) Country comparison to the world: 6th
Death rate
- 12 deaths/1,000 population (2018 est.)
Total fertility rate
- 5.58 children born/woman (2018 est.) Country comparison to the world: 8th
Population growth rate
- 2.91% (2018 est.) Country comparison to the world: 10th
Mother's mean age at first birth
- 19.2 years (2013/14 est.)
- note: median age at first birth among women 25-29
Net migration rate
- 0 migrant(s)/1,000 population (2018 est.) Country comparison to the world: 100th
Contraceptive prevalence rate
- 49% (2013/14)
Dependency ratios
- total dependency ratio: 91.9 (2015 est.)
- youth dependency ratio: 87.1 (2015 est.)
- elderly dependency ratio: 4.8 (2015 est.)
- potential support ratio: 20.8 (2015 est.)
Population distribution
- one of the highest levels of urbanization in Africa; high density in the central area, particularly around the cities of Lusaka, Ndola, Kitwe, and Mufulira
Urbanization
- urban population: 43.5% of total population (2018)
- rate of urbanization: 4.23% annual rate of change (2015-20 est.)
Sex ratio
- at birth: 1.03 male(s)/female
- under 15 years: 1.01 male(s)/female
- 15-64 years: 1.01 male(s)/female
- 65 years and over: 0.68 male(s)/female
- total population: 1 male(s)/female (2010 est.)
Life expectancy at birth
- total population: 53 years
- male: 51.4 years
- female: 54.7 years (2018 est.)
- total population: 52.7 years
- male: 51.1 years
- female: 54.4 years (2017 est.)
- total population:37.24 years
- male:37.08 years
- female:37.41 years (2000 est.)
Nationality
- noun:Zambian(s)
- adjective:Zambian
Demographic profile
Zambia's mineral rich, youthful population consists primarily of Bantu-speaking people representing nearly 70 different ethnicities. Zambia's high fertility rate continues to drive rapid population growth, averaging almost 3 percent annually between 2000 and 2010. The country's total fertility rate has fallen by less than 1.5 children per woman during the last 30 years and still averages among the world's highest, almost 6 children per woman, largely because of the country's lack of access to family planning services, education for girls, and employment for women. Zambia also exhibits wide fertility disparities based on rural or urban location, education, and income. Poor, uneducated women from rural areas are more likely to marry young, to give birth early, and to have more children, viewing children as a sign of prestige and recognizing that not all of their children will live to adulthood.[18]
Religions
- Protestant 75.3%
- Roman Catholic 20.2%
- Other 2.7% (includes Islam, Buddhist, Hindu, and Baháʼí)
- None 1.8% (2010 est.)
Languages
- Bemba 33.4%, Nyanja 14.7%, Tonga 11.4%, Lozi 5.5%, Chewa 4.5%, Nsenga 2.9%, Tumbuka 2.5%, Lunda (North Western) 1.9%, Kaonde 1.8%, Lala 1.8%, Lamba 1.8%, English (official) 1.7%, Luvale 1.5%, Mambwe 1.3%, Namwanga 1.2%, Lenje 1.1%, Bisa 1%, other 9.7%, unspecified 0.2% (2010 est.)
- note: Zambia is said to have over 70 languages, although many of these may be considered dialects; all of Zambia's major languages are members of the Bantu family
Literacy
definition: age 15 and over can read and write
- total population: 63.4%
- male: 70.9%
- female: 56% (2015 est.)
Unemployment, youth ages 15-24
- total: 15.2%
- male: 14.6%
- female: 15.8% (2012 est.)
See also
References
| Wikimedia Commons has media related to Demographics of Zambia. |
- Inc, IBP (2016-04-18). Zambia Investment and Business Guide Volume 2 Business, Investment Opportunities and Incentives. Lulu.com. ISBN 978-1-57751-907-2.
- Larmer, Miles (2016-07-07). "At the Crossroads". Oxford Handbooks Online. doi:10.1093/oxfordhb/9780199935369.013.20. ISBN 978-0-19-993536-9. Retrieved 2021-05-19.
- . CIA [=https://www.cia.gov/library/publications/the-world-factbook/fields/400.html =https://www.cia.gov/library/publications/the-world-factbook/fields/400.html].
{{cite web}}: Check|url=value (help); Missing or empty|title=(help) - ""World Population prospects – Population division"". population.un.org. United Nations Department of Economic and Social Affairs, Population Division. Retrieved November 9, 2019.
- ""Overall total population" – World Population Prospects: The 2019 Revision" (xslx). population.un.org (custom data acquired via website). United Nations Department of Economic and Social Affairs, Population Division. Retrieved November 9, 2019.
- "2015 Revision of World Population Prospects". Esa.un.org. Archived from the original on 2011-05-06. Retrieved 2016-08-09.
- De Wulf, Martin. "Zambia 2015". Population Pyramids of the World from 1950 to 2100.
- "UNSD — Demographic and Social Statistics".
- "UNSD — Demographic and Social Statistics".
- "Cambodia - Demographic and Health Survey 2010". Microdata.worldbank.org. Retrieved 2016-08-09.
- "National Health Survey 1998" (PDF). Dhsprogram.com. Retrieved 2016-08-09.
- "Demographic and Health Survey 2013-14" (PDF). Dhsprogram.com. Retrieved 7 November 2017.
- "Demographics of Zambia - demographics of zambia What i". ww.en.freejournal.info. Retrieved 2021-05-20.
- Mberu, Blessing U.; Reed, Holly E. (2014). "Understanding Subgroup Fertility Differentials in Nigeria". Population Review. 53 (2): 23–46. doi:10.1353/prv.2014.0006 (inactive 28 February 2022). ISSN 0032-471X. PMC 4326038. PMID 25684828.
{{cite journal}}: CS1 maint: DOI inactive as of February 2022 (link) - https://www.zamstats.gov.zm/phocadownload/2010_Census/2010%20Census%20of%20Population%20National%20Analytical%20Report.pdf
- "World Population Prospects - Population Division - United Nations". esa.un.org. Retrieved 2018-08-26.
- "Zambia Population 2019", World Population Review, June 6, 2018
- Zambia: People, CIA World Factbook, 2018
 This article incorporates text from this source, which is in the public domain.
 - "Africa :: ZAMBIA". CIA The World Factbook. 19 April 2022.