Burnaby North
Burnaby North is a provincial electoral district for the Legislative Assembly of British Columbia, Canada.
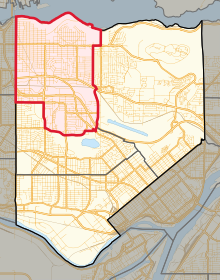 Location in Burnaby | |||
| Provincial electoral district | |||
| Legislature | Legislative Assembly of British Columbia | ||
| MLA |
New Democratic | ||
| District created | 1966 | ||
| First contested | 1966 | ||
| Last contested | 2020 | ||
| Demographics | |||
| Population (2001) | 53,415 | ||
| Area (km²) | 22.94 | ||
| Pop. density (per km²) | 2,328.5 | ||
| Census division(s) | Metro Vancouver | ||
| Census subdivision(s) | Burnaby | ||
History
MLAs
| Assembly | Years | Member | Party | |
|---|---|---|---|---|
| 28th | 1966–1969 | Eileen Dailly | New Democratic | |
| 29th | 1969–1972 | |||
| 30th | 1972–1975 | |||
| 31st | 1975–1979 | |||
| 32nd | 1979–1983 | |||
| 33rd | 1983–1986 | |||
| 34th | 1986–1991 | Barry Jones | ||
| 35th | 1991–1996 | |||
| 36th | 1996–2001 | Pietro Calendino | ||
| 37th | 2001–2005 | Richard T. Lee | Liberal | |
| 38th | 2005–2009 | |||
| 39th | 2009–2013 | |||
| 40th | 2013–2017 | |||
| 41st | 2017–2020 | Janet Routledge | New Democratic | |
| 42nd | 2020−present | |||
Election results
| 2020 British Columbia general election | ||||||||
|---|---|---|---|---|---|---|---|---|
| Party | Candidate | Votes | % | ±% | Expenditures | |||
| New Democratic | Janet Routledge | 12,894 | 57.80 | +9.23 | $41,933.88 | |||
| Liberal | Raymond Dong | 6,846 | 30.69 | −8.73 | $20,148.25 | |||
| Green | Norine Shim | 2,568 | 11.51 | −0.50 | $3,015.12 | |||
| Total valid votes | 22,308 | 100.00 | – | |||||
| Total rejected ballots | ||||||||
| Turnout | ||||||||
| Registered voters | ||||||||
| Source: Elections BC[1] | ||||||||
| 2017 British Columbia general election | ||||||||
|---|---|---|---|---|---|---|---|---|
| Party | Candidate | Votes | % | ±% | Expenditures | |||
| New Democratic | Janet Routledge | 11,448 | 48.57 | +1.75 | $53,926.39 | |||
| Liberal | Richard Lee | 9,290 | 39.42 | −4.43 | $62,342.21 | |||
| Green | Peter Hallschmid | 2,831 | 12.01 | +5.01 | $1,106.54 | |||
| Total valid votes | 23,569 | 100.00 | – | |||||
| Total rejected ballots | 171 | 0.72 | −0.03 | |||||
| Turnout | 23,740 | 60.39 | +5.36 | |||||
| Registered voters | 39,312 | |||||||
| Source: Elections BC[2][3] | ||||||||
| 2013 British Columbia general election | ||||||||
|---|---|---|---|---|---|---|---|---|
| Party | Candidate | Votes | % | |||||
| Liberal | Richard Lee | 10,543 | 46.82 | |||||
| New Democratic | Janet Routledge | 9,875 | 43.85 | |||||
| Green | Carrie McLaren | 1,577 | 7.00 | |||||
| No Affiliation | Wayne Michael Marklund | 523 | 2.32 | |||||
| Total valid votes | 22,518 | 100.00 | ||||||
| Total rejected ballots | 170 | 0.75 | ||||||
| Turnout | 22,688 | 55.03 | ||||||
| Source: Elections BC[4] | ||||||||
| Party | Candidate | Votes | % | ± | Expenditures | |
|---|---|---|---|---|---|---|
| Liberal | Richard Lee | 9,880 | 48.19% | $106,301 | ||
| New Democratic | Mondee Redman | 9,332 | 45.51% | $69,538 | ||
| Green | Doug Perry | 1,292 | 6.30% | – | $1,889 | |
| Total valid votes | 20,504 | 100% | ||||
| Total rejected ballots | 178 | 0.86% | ||||
| Turnout | 20,682 | 53.85% | ||||
| 2005 British Columbia general election | ||||||||
|---|---|---|---|---|---|---|---|---|
| Party | Candidate | Votes | % | |||||
| Liberal | Richard T. Lee | 10,421 | 45.59 | |||||
| New Democratic | Pietro Calendino | 10,356 | 45.31 | |||||
| Green | Richard Brand | 1,763 | 7.71 | |||||
| Democratic Reform | Matthew Laird | 316 | 1.38 | |||||
| Total Valid Votes | 22,856 | 100.00 | ||||||
| Total Rejected Ballots | 155 | 0.68 | ||||||
| Turnout | 23,011 | 59.76 | ||||||
| Party | Candidate | Votes | % | ± | Expenditures | |
|---|---|---|---|---|---|---|
| Liberal | Richard T. Lee | 11,062 | 54.37% | $38,089 | ||
| NDP | Pietro Calendino | 5,992 | 29.45% | $32,684 | ||
| Green | Tom Hetherington | 2,824 | 13.88% | – | $2,732 | |
| Marijuana | Dale Ware | 466 | 2.30% | $394 | ||
| Total valid votes | 20,344 | 100.00% | ||||
| Total rejected ballots | 102 | 0.50% | ||||
| Turnout | 20,446 | 71.52% | ||||
| Party | Candidate | Votes | % | ± | Expenditures | |
|---|---|---|---|---|---|---|
| NDP | Pietro Calendino | 8,926 | 45.47% | $43,634 | ||
| Liberal | Richard T. Lee | 8,160 | 41.57% | $42,888 | ||
| Reform | Daniela Bosa | 1,081 | 5.51% | |||
| Progressive Democrat | Richard A.Y. Lee | 976 | 4.97% | – | $1,099 | |
| Green | Tom Hetherington | 395 | 2.01% | – | $930 | |
| Natural Law | Derek Nadeau | 62 | 0.32% | $122 | ||
| Libertarian | Carlo Nigro | 31 | 0.16% | $100 | ||
| Total valid votes | 19,631 | 100.00% | ||||
| Total rejected ballots | 180 | 0.91% | ||||
| Turnout | 19,811 | 72.70% | ||||
| Party | Candidate | Votes | % | ± | Expenditures | |
|---|---|---|---|---|---|---|
| NDP | Barry Jones | 9,809 | 48.43% | $28,085 | ||
| Liberal | Gaetan C. Myre | 6,337 | 31.29% | $1,895 | ||
| Social Credit | Margaret Woods | 3,833 | 18.92% | – | $31,779 | |
| Green | Jeani P. Lytle | 194 | 0.96% | – | $711 | |
| Libertarian | Carlo Nigro | 81 | 0.40% | |||
| Total valid votes | 20,254 | 100.00% | ||||
| Total rejected ballots | 449 | 2.17% | ||||
| Turnout | 20,703 | 75.24% | ||||
References
- "2020 Provincial General Election Final Voting Results". electionsbcenr.blob.core.windows.net. Retrieved December 17, 2020.
- "2017 Provincial General Election - Statement of Votes" (PDF). Elections BC. Retrieved May 11, 2017.
- "Election Financing Reports". Elections BC. Retrieved September 12, 2020.
- "Statement of Votes - 40th Provincial General Election" (PDF). Elections BC. Retrieved May 17, 2017.
External links
- BC Stats
- Results of 2001 election (pdf)
- 2001 Expenditures (pdf)
- Results of 1996 election
- 1996 Expenditures
- Results of 1991 election
- 1991 Expenditures
- Website of the Legislative Assembly of British Columbia
This article is issued from Wikipedia. The text is licensed under Creative Commons - Attribution - Sharealike. Additional terms may apply for the media files.