2006 Barking and Dagenham London Borough Council election
Elections for Barking and Dagenham London Borough Council were held on Thursday 4 May 2006. The whole council was up for election. Barking and Dagenham is split up into 17 wards, each electing 3 councillors, so a total of 51 seats were up for election.
| |||||||||||||||||||||||||||||||||
All 51 council seats to Barking and Dagenham Council 26 seats needed for a majority | |||||||||||||||||||||||||||||||||
|---|---|---|---|---|---|---|---|---|---|---|---|---|---|---|---|---|---|---|---|---|---|---|---|---|---|---|---|---|---|---|---|---|---|
| |||||||||||||||||||||||||||||||||
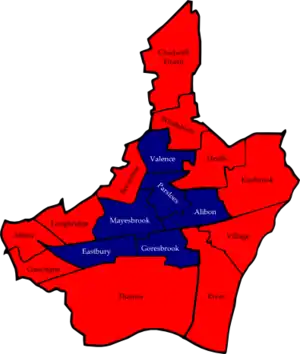
 Map of the results of the 2006 Barking and Dagenham council election. Labour in red, British National Party in dark blue and Conservatives in blue. | |||||||||||||||||||||||||||||||||
| |||||||||||||||||||||||||||||||||
The Labour Party retained control of the council winning 38 seats and 41% of the popular vote. The BNP won 12 seats and formed the official opposition winning 17% of the popular vote. The Conservatives won 1 seat.[1][2]
Background
115 candidates nominated in total. Labour again ran a full slate (51) and was the only party to do so. By contrast the Conservative Party ran only 23 candidates , whilst the Liberal Democrats ran 4 and the BNP ran 13.
Election results
| Party | Seats | Gains | Losses | Net gain/loss | Seats % | Votes % | Votes | +/− | |
|---|---|---|---|---|---|---|---|---|---|
| Labour | 38 | 8 | 12 | –4 | 74.5 | 41.2 | 20,611 | -14.4 | |
| Conservative | 1 | 1 | 2 | –1 | 2.0 | 18.6 | 9,315 | +4.8 | |
| BNP | 12 | 12 | 0 | +12 | 23.5 | 17.2 | 8,576 | N/A | |
| UKIP | 0 | 0 | 0 | ±0 | 0.0 | 13.2 | 6,598 | N/A | |
| Independent | 0 | 0 | 0 | ±0 | 0.0 | 4.7 | 2,353 | +3.9 | |
| Green | 0 | 0 | 0 | ±0 | 0.0 | 3.5 | 1,730 | +2.3 | |
| Liberal Democrats | 0 | 0 | 3 | –3 | 0.0 | 1.6 | 810 | -21.6 | |
| Chadwell Heath RA | 0 | 0 | 4 | –4 | 0.0 | 0.0 | 0 | -5.5 | |
Ward results
Abbey
| Party | Candidate | Votes | % | ±% | |
|---|---|---|---|---|---|
| Labour | Jeanne Alexander | 1,367 | 64.3 | -5.8 | |
| Labour | Mohammed Fani | 1,275 | |||
| Labour | Graham Bramley | 1,241 | |||
| Conservative | Foyzur Rahman | 765 | 35.7 | N/A | |
| Turnout | 2,203 | 29.9 | +7.0 | ||
| Registered electors | 7,379 | ||||
| Labour hold | Swing | ||||
| Labour hold | Swing | ||||
| Labour hold | Swing | ||||
Alibon
| Party | Candidate | Votes | % | ±% | |
|---|---|---|---|---|---|
| BNP | William Bailey | 1,329 | 41.7 | N/A | |
| BNP | Claire Doncaster | 1,323 | |||
| Labour | John Davis | 1,071 | 33.6 | -33.8 | |
| Labour | Terry Wade | 1,018 | |||
| Labour | Dave Miles | 957 | |||
| UKIP | Margaret Whitson | 394 | 12.4 | N/A | |
| Conservative | Lucy East | 393 | 12.3 | -20.3 | |
| Turnout | 2,759 | 41.1 | +22.0 | ||
| Registered electors | 6,721 | ||||
| BNP gain from Labour | Swing | ||||
| BNP gain from Labour | Swing | ||||
| Labour hold | Swing | ||||
Becontree
| Party | Candidate | Votes | % | ±% | |
|---|---|---|---|---|---|
| Labour | Alok Agrawal | 1,268 | 47.3 | -18.5 | |
| Labour | Evelyn Carpenter | 1,240 | |||
| Labour | Emmanuel Obasohan | 1,058 | |||
| UKIP | Daphne Jordon | 749 | 28.1 | N/A | |
| Conservative | Claire Barker | 653 | 24.5 | N/A | |
| Conservative | Malcolm Barker | 607 | |||
| Turnout | 2,454 | 32.4 | +15.4 | ||
| Registered electors | 7,578 | ||||
| Labour hold | Swing | ||||
| Labour hold | Swing | ||||
| Labour hold | Swing | ||||
Chadwell Heath
| Party | Candidate | Votes | % | ±% | |
|---|---|---|---|---|---|
| Labour | Sarah Baillie | 1,101 | 37.7 | +6.7 | |
| Labour | Nadine Smith | 999 | |||
| Labour | Shaun Carroll | 987 | |||
| Conservative | Terry Justice | 873 | 29.9 | -3.6 | |
| Conservative | Maire Justice | 734 | |||
| Conservative | Sharron Chytry | 583 | |||
| Independent | Ronald Curtis | 560 | 19.2 | -16.4 | |
| UKIP | Doreen Tucker | 385 | 13.2 | N/A | |
| UKIP | Ronald Long | 376 | |||
| Turnout | 2,523 | 36.2 | +9.5 | ||
| Registered electors | 6,972 | ||||
| Labour gain from Residents | Swing | ||||
| Labour gain from Residents | Swing | ||||
| Labour gain from Conservative | Swing | ||||
Eastbrook
| Party | Candidate | Votes | % | ±% | |
|---|---|---|---|---|---|
| Labour | Mick McCarthy | 1,151 | 50.3 | -1.5 | |
| Conservative | Neil Connelly | 1,139 | 49.7 | +12.3 | |
| Labour | Bob Little | 1,126 | |||
| Conservative | Sue Connelly | 1,101 | |||
| Conservative | Susan Smith | 1,067 | |||
| Labour | Margaret Mullane | 1,036 | |||
| Turnout | 4,070 | 54.1 | +28.5 | ||
| Registered electors | 7,523 | ||||
| Labour hold | Swing | ||||
| Conservative gain from Labour | Swing | ||||
| Labour hold | Swing | ||||
Eastbury
| Party | Candidate | Votes | % | ±% | |
|---|---|---|---|---|---|
| BNP | Jeffrey Steed | 1,102 | 32.4 | N/A | |
| Labour | James McDermott | 965 | 28.4 | -15.2 | |
| Labour | Patricia Northover | 944 | |||
| Labour | Hardial Rai | 852 | |||
| UKIP | Patrick Manley | 546 | 16.1 | N/A | |
| Liberal Democrats | Diane Challis | 523 | 15.4 | -41.0 | |
| UKIP | Ashley McIlroy | 455 | |||
| Liberal Democrats | Ryan Edwards | 451 | |||
| UKIP | Dorien McIlroy | 425 | |||
| Green | Geoff Sheridan | 260 | 7.7 | N/A | |
| Liberal Democrats | Claire Stepton | 131 | |||
| Turnout | 3,031 | 39.4 | +13.6 | ||
| Registered electors | 7,967 | ||||
| BNP gain from Liberal Democrats | Swing | ||||
| Labour gain from Liberal Democrats | Swing | ||||
| Labour gain from Liberal Democrats | Swing | ||||
Gascoigne
| Party | Candidate | Votes | % | ±% | |
|---|---|---|---|---|---|
| Labour | Kathleen Flint | 1,579 | 58.8 | -5.9 | |
| Labour | Milton McKenzie | 1,346 | |||
| Labour | Valerie Rush | 1,278 | |||
| Conservative | Alison Grey | 586 | 21.8 | N/A | |
| Green | Hidir Yildirim | 522 | 19.4 | +9.1 | |
| Turnout | 2,361 | 33.0 | +8.8 | ||
| Registered electors | 7,146 | ||||
| Labour hold | Swing | ||||
| Labour hold | Swing | ||||
| Labour hold | Swing | ||||
Goresbrook
| Party | Candidate | Votes | % | ±% | |
|---|---|---|---|---|---|
| BNP | Richard Barnbrook | 1,434 | 42.4 | N/A | |
| BNP | Tracy Lansdown | 1,357 | |||
| Labour | Warren Northover | 1,204 | 35.6 | -36.4 | |
| Labour | Edna Fergus | 1,162 | |||
| Labour | Jeffrey Porter | 1,135 | |||
| Conservative | George Naylor | 373 | 11.0 | N/A | |
| UKIP | Terence Jones | 367 | 10.9 | N/A | |
| Turnout | 3,021 | 41.4 | +21.1 | ||
| Registered electors | 7,298 | ||||
| BNP gain from Labour | Swing | ||||
| BNP gain from Labour | Swing | ||||
| Labour hold | Swing | ||||
Heath
| Party | Candidate | Votes | % | ±% | |
|---|---|---|---|---|---|
| Labour | Charles Fairbrass | 1,293 | 48.6 | -9.0 | |
| Labour | Linda Reason | 1,282 | |||
| Labour | Sidney Kallar | 1,229 | |||
| UKIP | Christine Smith | 790 | 29.7 | N/A | |
| Conservative | Harry East | 579 | 21.8 | +0.0 | |
| Conservative | Margaret White | 535 | |||
| Turnout | 2,534 | 34.3 | +12.5 | ||
| Registered electors | 7,396 | ||||
| Labour hold | Swing | ||||
| Labour hold | Swing | ||||
| Labour hold | Swing | ||||
Longbridge
| Party | Candidate | Votes | % | ±% | |
|---|---|---|---|---|---|
| Labour | Sukhninder Gill | 1,272 | 26.2 | -16.0 | |
| Labour | Nirmal Gill | 1,253 | |||
| Labour | Gerald Vincent | 1,233 | |||
| Conservative | Brian Cook | 1,227 | 25.2 | -14.2 | |
| Conservative | Margaret Cook | 1,111 | |||
| Independent | Anthony Richards | 1,072 | 22.1 | N/A | |
| Conservative | Anthony Chytry | 910 | |||
| UKIP | James Burchill | 701 | 14.4 | N/A | |
| Green | Laurence Cleeland | 588 | 12.1 | N/A | |
| Turnout | 3,661 | 48.5 | +18.9 | ||
| Registered electors | 7,543 | ||||
| Labour hold | Swing | ||||
| Labour hold | Swing | ||||
| Labour gain from Conservative | Swing | ||||
Mayesbrook
| Party | Candidate | Votes | % | ±% | |
|---|---|---|---|---|---|
| BNP | Robert Buckley | 1,145 | 38.4 | N/A | |
| BNP | Christine Knight | 1,070 | |||
| Labour | Dee Hunt | 845 | 28.4 | -24.0 | |
| UKIP | Vivian Patten | 741 | 24.9 | N/A | |
| UKIP | Kerry Smith | 733 | |||
| UKIP | John Bolton | 697 | |||
| Labour | Dominic Twomey | 695 | |||
| Labour | Ahmed Choudhury | 679 | |||
| Conservative | Christopher Newton | 249 | 8.4 | N/A | |
| Turnout | 2,782 | 40.4 | +19.6 | ||
| Registered electors | 6,886 | ||||
| BNP gain from Labour | Swing | ||||
| BNP gain from Labour | Swing | ||||
| Labour hold | Swing | ||||
Parsloes
| Party | Candidate | Votes | % | ±% | |
|---|---|---|---|---|---|
| BNP | Ronald Doncaster | 1,120 | 43.2 | N/A | |
| BNP | Darren Tuffs | 1,052 | |||
| Labour | Herbert Collins | 1,050 | 40.5 | -22.2 | |
| Labour | Frederick Jones | 1,026 | |||
| Labour | Catherine Osborn | 948 | |||
| UKIP | Peter Compobassi | 423 | 16.3 | N/A | |
| Turnout | 2,465 | 37.1 | +17.2 | ||
| Registered electors | 6,643 | ||||
| BNP gain from Labour | Swing | ||||
| BNP gain from Labour | Swing | ||||
| Labour hold | Swing | ||||
River
| Party | Candidate | Votes | % | ±% | |
|---|---|---|---|---|---|
| Labour | Liam Smith | 1,529 | 50.9 | -18.5 | |
| Labour | Patricia Twomey | 1,406 | |||
| Labour | Inder Jamu | 1,304 | |||
| UKIP | Betty Parsons | 858 | 28.6 | N/A | |
| Conservative | Herbert White | 617 | 20.5 | N/A | |
| Turnout | 2,649 | 35.7 | +15.3 | ||
| Registered electors | 7,419 | ||||
| Labour hold | Swing | ||||
| Labour hold | Swing | ||||
| Labour hold | Swing | ||||
Thames
| Party | Candidate | Votes | % | ±% | |
|---|---|---|---|---|---|
| Labour | Fred Barns | 1,264 | 51.5 | -16.1 | |
| Labour | Joan Rawlinson | 1,157 | |||
| Labour | Barry Poulton | 1,127 | |||
| Independent | John Dias-Broughton | 721 | 29.4 | N/A | |
| Conservative | Thomas Grey | 470 | 19.1 | N/A | |
| Turnout | 2,224 | 30.8 | +7.1 | ||
| Registered electors | 7,223 | ||||
| Labour hold | Swing | ||||
| Labour hold | Swing | ||||
| Labour hold | Swing | ||||
Valence
| Party | Candidate | Votes | % | ±% | |
|---|---|---|---|---|---|
| BNP | Sandra Doncaster | 1,219 | 40.3 | N/A | |
| BNP | Lawrence Rustem | 1,203 | |||
| Labour | Donald Hemmett | 1,071 | 35.4 | -32.2 | |
| Labour | Dennis O'Brien | 1,005 | |||
| Labour | Bryan Osborn | 915 | |||
| UKIP | Angela Lambart | 372 | 12.3 | N/A | |
| Green | Maria Sentivani | 360 | 11.9 | N/A | |
| Turnout | 2,649 | 39.8 | +19.5 | ||
| Registered electors | 6,662 | ||||
| BNP gain from Labour | Swing | ||||
| BNP gain from Labour | Swing | ||||
| Labour hold | Swing | ||||
Village
| Party | Candidate | Votes | % | ±% | |
|---|---|---|---|---|---|
| Labour | Philip Waker | 1,276 | 37.2 | -18.0 | |
| Labour | Lee Waker | 1,269 | |||
| BNP | Jamie Jarvis | 1,227 | 35.8 | N/A | |
| Labour | Bill Dale | 1,209 | |||
| BNP | James Webb | 1,208 | |||
| Conservative | Kenneth Coombs | 370 | 10.8 | -12.5 | |
| Liberal Democrats | Fredrick Tindling | 287 | 8.4 | -13.1 | |
| UKIP | Leslie Parsons | 272 | 7.9 | N/A | |
| Turnout | 2,990 | 42.2 | +19.8 | ||
| Registered electors | 7,089 | ||||
| Labour hold | Swing | ||||
| Labour hold | Swing | ||||
| BNP gain from Labour | Swing | ||||
Whalebone
| Party | Candidate | Votes | % | ±% | |
|---|---|---|---|---|---|
| Labour | John Denyer | 1,304 | 56.1 | +15.5 | |
| Labour | Marie West | 1,208 | |||
| Labour | John White | 1,159 | |||
| Conservative | Paul Taylor | 1,021 | 43.9 | +26.2 | |
| Conservative | Christine Naylor | 1,014 | |||
| Turnout | 2,530 | 26.2 | +0.0 | ||
| Registered electors | 6,922 | ||||
| Labour gain from Residents | Swing | ||||
| Labour gain from Residents | Swing | ||||
| Labour hold | Swing | ||||
By-elections between 2006 and 2010
Chadwell Heath
| Party | Candidate | Votes | % | ±% | |
|---|---|---|---|---|---|
| Conservative | Terry Justice | 842 | 37.4 | +7.5 | |
| Labour | Margaret Mullane | 691 | 30.7 | -7.0 | |
| BNP | James Webb | 564 | 25.1 | +25.1 | |
| UKIP | Kerry Smith | 142 | 6.3 | -6.9 | |
| Independent | Dorien Mcilroy | 11 | 0.5 | -18.7 | |
| Majority | 151 | 6.7 | N/A | ||
| Turnout | 33.1 | -3.1 | |||
| Registered electors | |||||
| Conservative gain from Labour | Swing | ||||
The by-election was called following the resignation of Cllr. Sarah Baillie.
References
- "London Borough Council Elections 4 May 2006" (PDF). London Datastore. London Residuary Body. Retrieved 25 May 2019.
- "London Borough of Barking & Dagenham Election Results 1964-2010" (PDF). Elections Centre. Plymouth University. Retrieved 25 May 2019.
- "London Borough Council Elections 6 May 2010" (PDF). London Datastore. London Residuary Body. Retrieved 31 May 2019.
- "London Borough By Election results". Gwydir. Keith Edkins. Retrieved 25 May 2019.
- "Barking and Dagenham by-election results". Barking and Dagenham Council elections. Barking and Dagenham Council. Retrieved 29 May 2019.