2002 Bassetlaw District Council election
The 2002 Bassetlaw District Council election took place on 2 May 2002 to elect members of Bassetlaw District Council in Nottinghamshire, England as part of the 2002 United Kingdom local elections.
| |||||||||||||
All seats to Bassetlaw District Council (48 seats) 25 seats needed for a majority | |||||||||||||
|---|---|---|---|---|---|---|---|---|---|---|---|---|---|
| |||||||||||||
 | |||||||||||||
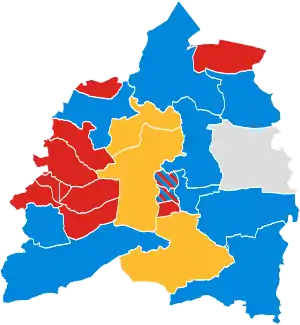
The whole council was elected due to changes to ward boundaries following an electoral review by the Boundary Committee for England.[1]
Election result
The Labour Party won a majority of seats and retained control of the council.
Ward results
Beckingham
| Party | Candidate | Votes | % | ±% | |
|---|---|---|---|---|---|
| Conservative | Kenneth Bullivant (elected unopposed) | N/A | N/A | N/A | |
| Turnout | N/A | N/A | |||
| Conservative win (new seat) | |||||
Blyth
| Party | Candidate | Votes | % | ±% | |
|---|---|---|---|---|---|
| Conservative | Terence Yates | 378 | 69.7% | ||
| Labour | Robert Earp | 164 | 30.3% | ||
| Turnout | 547 | 30.1% | |||
| Conservative win (new seat) | |||||
Carlton
| Party | Candidate | Votes | % | ±% | |
|---|---|---|---|---|---|
| Labour | Alastair Williams | 870 | 55.7% | ||
| Labour | William Walters | 868 | |||
| Labour | Jill Freeman | 743 | |||
| Conservative | David Hare | 692 | 44.3% | ||
| Conservative | Val Bowles | 586 | |||
| Conservative | Barry Bowles | 577 | |||
| Turnout | 1,561 | 33.8% | |||
| Labour win (new seat) | |||||
| Labour win (new seat) | |||||
| Labour win (new seat) | |||||
Clayworth
| Party | Candidate | Votes | % | ±% | |
|---|---|---|---|---|---|
| Conservative | Kathleen Sutton | 435 | 70.6% | ||
| Labour | Carl Phillips | 95 | 15.4% | ||
| Liberal Democrats | Alison Murray | 86 | 14.0% | ||
| Turnout | 627 | 39.8% | |||
| Conservative win (new seat) | |||||
East Markham
| Party | Candidate | Votes | % | ±% | |
|---|---|---|---|---|---|
| Liberal Democrats | Pamela Lewis | 592 | 65.0% | ||
| Conservative | Christopher Pataky | 319 | 35.0% | ||
| Turnout | 913 | 51.0% | |||
| Liberal Democrats win (new seat) | |||||
East Retford East
| Party | Candidate | Votes | % | ±% | |
|---|---|---|---|---|---|
| Conservative | Wendy Quigley | 1,147 | 59.8% | ||
| Conservative | Michael Quigley | 1,057 | |||
| Conservative | James Holland | 898 | |||
| Labour | Faith Gabbitas | 399 | 20.8% | ||
| Labour | Michael Gee | 388 | |||
| Labour | George Gabbitas | 377 | |||
| Liberal Democrats | Lawrence Hudson | 245 | 12.8% | ||
| Liberal Democrats | Tegfryn Davies | 211 | |||
| Liberal Democrats | Mark Hunter | 168 | |||
| Green | Victor Chidlaw | 128 | 6.7% | ||
| Turnout | 1,790 | 34.3% | |||
| Conservative win (new seat) | |||||
| Conservative win (new seat) | |||||
| Conservative win (new seat) | |||||
East Retford North
| Party | Candidate | Votes | % | ±% | |
|---|---|---|---|---|---|
| Labour | Graham Oxby | 801 | 52.8% | ||
| Labour | James Napier | 719 | |||
| Conservative | Michael Pugsley | 717 | 47.2% | ||
| Conservative | Christopher Hall | 690 | |||
| Labour | Pamela Skelding | 590 | |||
| Turnout | 1,522 | 32.5% | |||
| Labour win (new seat) | |||||
| Labour win (new seat) | |||||
| Conservative win (new seat) | |||||
East Retford South
| Party | Candidate | Votes | % | ±% | |
|---|---|---|---|---|---|
| Labour | Carolyn Troop | 591 | 67.6% | ||
| Labour | Lionel Skelding | 527 | |||
| Conservative | Barry Frost | 283 | 32.4% | ||
| Conservative | Sheelagh Hamilton | 261 | |||
| Turnout | 907 | 27.4% | |||
| Labour win (new seat) | |||||
| Labour win (new seat) | |||||
East Retford West
| Party | Candidate | Votes | % | ±% | |
|---|---|---|---|---|---|
| Conservative | Marie Critchley | 412 | 51.0% | ||
| Labour | Jim Anderson | 396 | 49.0% | ||
| Conservative | Anna-Maria Robinson | 378 | |||
| Labour | Philip Goodliffe | 332 | |||
| Turnout | 816 | 25.5% | |||
| Conservative win (new seat) | |||||
| Labour win (new seat) | |||||
Everton
| Party | Candidate | Votes | % | ±% | |
|---|---|---|---|---|---|
| Conservative | Francis Martin | 412 | 74.4% | ||
| Labour | Jane Heggie | 142 | 25.6% | ||
| Turnout | 557 | 32.1% | |||
| Conservative win (new seat) | |||||
Harworth
| Party | Candidate | Votes | % | ±% | |
|---|---|---|---|---|---|
| Labour | Frank Hart | 806 | 60.8% | ||
| Labour | Keith Muskett | 783 | |||
| Labour | Margaret Muskett | 718 | |||
| Independent | George Burchby | 519 | 39.2% | ||
| Turnout | 1,284 | 22.9% | |||
| Labour win (new seat) | |||||
| Labour win (new seat) | |||||
| Labour win (new seat) | |||||
Langold
| Party | Candidate | Votes | % | ±% | |
|---|---|---|---|---|---|
| Labour | Sara Jackson (elected unopposed) | N/A | N/A | N/A | |
| Turnout | N/A | N/A | |||
| Labour win (new seat) | |||||
Misterton
| Party | Candidate | Votes | % | ±% | |
|---|---|---|---|---|---|
| Labour | Jose Barry | 368 | 65.0% | ||
| Conservative | John Ogle | 198 | 35.0% | ||
| Turnout | 559 | 30.5% | |||
| Labour win (new seat) | |||||
Rampton
| Party | Candidate | Votes | % | ±% | |
|---|---|---|---|---|---|
| Conservative | Jeffery Rickells (elected unopposed) | N/A | N/A | N/A | |
| Turnout | N/A | N/A | |||
| Conservative win (new seat) | |||||
Ranskill
| Party | Candidate | Votes | % | ±% | |
|---|---|---|---|---|---|
| Liberal Democrats | Sean Kerrigan | 342 | 58.0% | ||
| Conservative | Carol Sharp | 248 | 42.0% | ||
| Turnout | 1,684 | 35.8% | |||
| Liberal Democrats win (new seat) | |||||
Sturton
| Party | Candidate | Votes | % | ±% | |
|---|---|---|---|---|---|
| Independent | Hugh Burton (elected unopposed) | N/A | N/A | N/A | |
| Turnout | N/A | N/A | |||
| Independent win (new seat) | |||||
Sutton
| Party | Candidate | Votes | % | ±% | |
|---|---|---|---|---|---|
| Liberal Democrats | Alan Kitchen | 461 | 70.5% | ||
| Conservative | Elizabeth Yates | 193 | 29.5% | ||
| Turnout | 656 | 41.4% | |||
| Liberal Democrats win (new seat) | |||||
Tuxford and Trent
| Party | Candidate | Votes | % | ±% | |
|---|---|---|---|---|---|
| Conservative | Keith Isard | 761 | 58.2% | ||
| Conservative | Robert Sutton | 729 | |||
| Labour | John Hobart | 398 | 30.4% | ||
| Labour | Carol Gee | 275 | |||
| Liberal Democrats | Philip Lewis | 149 | 11.4% | ||
| Turnout | 1,232 | 39.3% | |||
| Conservative win (new seat) | |||||
| Conservative win (new seat) | |||||
Welbeck
| Party | Candidate | Votes | % | ±% | |
|---|---|---|---|---|---|
| Conservative | Mary Stokes | 335 | 52.2% | ||
| Independent | Stanley Moody | 307 | 47.8% | ||
| Turnout | 645 | 38.8% | |||
| Conservative win (new seat) | |||||
Worksop East
| Party | Candidate | Votes | % | ±% | |
|---|---|---|---|---|---|
| Labour | Griff Wynne | 709 | 46.6% | ||
| Labour | James Elliott | 708 | |||
| Labour | Cliff Entwistle | 688 | |||
| Independent | Geoff Coe | 523 | 34.4% | ||
| Green | Paul Thorpe | 288 | 18.9% | ||
| Turnout | 1,377 | 26.7% | |||
| Labour win (new seat) | |||||
| Labour win (new seat) | |||||
| Labour win (new seat) | |||||
Worksop North
| Party | Candidate | Votes | % | ±% | |
|---|---|---|---|---|---|
| Labour | Avril Barsley | 696 | 61.1% | ||
| Labour | Allan Makeman | 667 | |||
| Labour | John Clayton | 501 | |||
| Conservative | Marilyn Parkin | 443 | 38.9% | ||
| Turnout | 1,196 | 20.2% | |||
| Labour win (new seat) | |||||
| Labour win (new seat) | |||||
| Labour win (new seat) | |||||
Worksop North East
| Party | Candidate | Votes | % | ±% | |
|---|---|---|---|---|---|
| Labour | Simon Greaves | 867 | 58.5% | ||
| Labour | David Walsh | 658 | |||
| Labour | Janet Pimperton | 652 | |||
| Conservative | Christopher Coward | 614 | 41.5% | ||
| Conservative | Stephen Parkin | 601 | |||
| Conservative | Juliana Smith | 567 | |||
| Turnout | 1,593 | 30.9% | |||
| Labour win (new seat) | |||||
| Labour win (new seat) | |||||
| Labour win (new seat) | |||||
Worksop North West
| Party | Candidate | Votes | % | ±% | |
|---|---|---|---|---|---|
| Labour | David Pressley | 740 | 53.8% | ||
| Labour | Glynn Gilfoyle | 728 | |||
| Labour | Alan Rhodes | 668 | |||
| Conservative | Carole Mangham | 372 | 27.0% | ||
| Green | Andrew Cliffe | 264 | 19.2% | ||
| Turnout | 1,234 | 24.5% | |||
| Labour win (new seat) | |||||
| Labour win (new seat) | |||||
| Labour win (new seat) | |||||
Worksop South
| Party | Candidate | Votes | % | ±% | |
|---|---|---|---|---|---|
| Conservative | Reginald Askew | 861 | 51.7% | ||
| Conservative | Michael Bennett | 785 | |||
| Conservative | Andrew Dibb | 665 | |||
| Labour | Christopher Grocock | 436 | 26.2% | ||
| Independent | Michael Dunford | 369 | 22.1% | ||
| Labour | Sarah Gale | 339 | |||
| Labour | Eileen Hart | 324 | |||
| Turnout | 1,379 | 27.9% | |||
| Conservative win (new seat) | |||||
| Conservative win (new seat) | |||||
| Conservative win (new seat) | |||||
References
- "Bassetlaw - LGBCE". Local Government Boundary Commission for England. Retrieved 1 December 2021.
This article is issued from Wikipedia. The text is licensed under Creative Commons - Attribution - Sharealike. Additional terms may apply for the media files.