1984 elections in India
 |
|---|
|
|
General Elections
 | ||||
| Party | Votes | % | Seats | |
|---|---|---|---|---|
| Indian National Congress | 115,478,267 | 49.10 | 404 | |
| Bharatiya Janata Party | 18,202,853 | 7.74 | 2 | |
| Janata Party | 16,210,514 | 6.89 | 10 | |
| Lokdal | 14,040,064 | 5.97 | 3 | |
| Communist Party of India (Marxist) | 13,809,950 | 5.87 | 22 | |
| Telugu Desam Party | 10,132,859 | 4.31 | 30 | |
| Communist Party of India | 6,363,430 | 2.71 | 6 | |
| Dravida Munnetra Kazhagam | 5,695,179 | 2.42 | 2 | |
| All India Anna Dravida Munnetra Kazhagam | 3,968,967 | 1.69 | 12 | |
| Indian Congress (Socialist) | 3,577,377 | 1.52 | 4 | |
| Indian National Congress (Jagjivan) | 1,511,515 | 0.64 | 1 | |
| Revolutionary Socialist Party | 1,173,869 | 0.50 | 3 | |
| All India Forward Bloc | 1,055,556 | 0.45 | 2 | |
| Jammu & Kashmir National Conference | 1,010,243 | 0.43 | 3 | |
| Indian Union Muslim League | 658,821 | 0.28 | 2 | |
| Kerala Congress (Joseph) | 598,113 | 0.25 | 2 | |
| Doordarshi Party | 508,426 | 0.22 | 0 | |
| Peasants and Workers Party of India | 463,963 | 0.20 | 1 | |
| Jharkhand Mukti Morcha | 332,403 | 0.14 | 0 | |
| Kerala Congress | 258,591 | 0.11 | 0 | |
| All India Muslim League | 224,155 | 0.10 | 0 | |
| Gandhi Kamraj National Congress | 217,104 | 0.09 | 0 | |
| Socialist Unity Centre of India | 196,767 | 0.08 | 0 | |
| Republican Party of India (Khobragade) | 165,320 | 0.07 | 0 | |
| Manipur Peoples Party | 149,019 | 0.06 | 0 | |
| Tamil Nadu Congress (K) | 144,076 | 0.06 | 0 | |
| Naga National Democratic Party | 113,919 | 0.05 | 0 | |
| Jammu & Kashmir Panthers Party | 95,149 | 0.04 | 0 | |
| Maharashtrawadi Gomantak Party | 83,122 | 0.04 | 0 | |
| People's Party of Arunachal | 78,455 | 0.03 | 0 | |
| Republican Party of India | 22,877 | 0.01 | 0 | |
| Jharkhand Party | 18,837 | 0.01 | 0 | |
| Jammu & Kashmir Peoples Conference | 646 | 0.00 | 0 | |
| Independents | 18,623,803 | 7.92 | 5 | |
| Appointed Anglo-Indians | 2 | |||
| Total | 235,184,209 | 100.00 | 516 | |
| Valid votes | 235,184,209 | 97.49 | ||
| Invalid/blank votes | 6,062,678 | 2.51 | ||
| Total votes | 241,246,887 | 100.00 | ||
| Registered voters/turnout | 379,540,608 | 63.56 | ||
| Source: ECI[1] | ||||
Delayed elections in Assam and Punjab
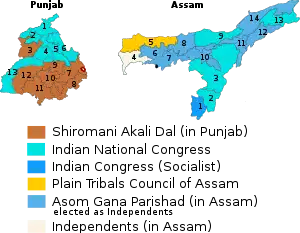
Results from 1985
| Party | Votes | % | Seats | |
|---|---|---|---|---|
| Indian National Congress | 4,628,777 | 32.14 | 10 | |
| Shiromani Akali Dal | 2,577,279 | 17.90 | 7 | |
| Communist Party of India (Marxist) | 462,576 | 3.21 | 0 | |
| Indian Congress (Socialist) | 457,705 | 3.18 | 1 | |
| Communist Party of India | 369,687 | 2.57 | 0 | |
| Plain Tribals Council of Assam | 310,150 | 2.15 | 1 | |
| Bharatiya Janata Party | 263,284 | 1.83 | 0 | |
| Janata Party | 420,082 | 2.92 | 0 | |
| Lokdal | 46,627 | 0.32 | 0 | |
| Independents | 4,864,958 | 33.78 | 8 | |
| Total | 14,401,125 | 100.00 | 27 | |
| Valid votes | 14,401,125 | 95.70 | ||
| Invalid/blank votes | 646,951 | 4.30 | ||
| Total votes | 15,048,076 | 100.00 | ||
| Registered voters/turnout | 20,834,725 | 72.23 | ||
| Source: ECI[2] | ||||
Legislative Assembly elections
Arunachal Pradesh
Source:[3]
| Party | Contested | Won | Votes | % |
|---|---|---|---|---|
| INC | 30 | 21 | 96791 | 43.07% |
| PPA | 13 | 4 | 34910 | 15.54% |
| BJP | 6 | 1 | 17,283 | 7.69% |
| JNP | 3 | 0 | 845 | 0.38% |
| Independents | 63 | 4 | 74888 | 33.33% |
| Total | 115 | 30 | 224717 | |
Goa, Daman and Diu
 | |||||
| Party | Votes | % | Seats | +/– | |
|---|---|---|---|---|---|
| Indian National Congress | 160,944 | 39.48 | 18 | +18 | |
| Maharashtrawadi Gomantak Party | 86,100 | 21.12 | 8 | +1 | |
| Bharatiya Janata Party | 4,915 | 1.21 | 0 | New | |
| Janata Party | 3,013 | 0.74 | 0 | 0 | |
| Communist Party of India | 1,554 | 0.38 | 0 | New | |
| Communist Party of India (Marxist) | 756 | 0.19 | 0 | 0 | |
| Independents | 150,424 | 36.90 | 4 | +1 | |
| Total | 407,706 | 100.00 | 30 | 0 | |
| Valid votes | 407,706 | 96.72 | |||
| Invalid/blank votes | 13,844 | 3.28 | |||
| Total votes | 421,550 | 100.00 | |||
| Registered voters/turnout | 586,657 | 71.86 | |||
| Source: ECI[4] | |||||
Manipur
 | |||||
| Party | Votes | % | Seats | +/– | |
|---|---|---|---|---|---|
| Indian National Congress | 257,809 | 29.82 | 30 | +30 | |
| Manipur Peoples Party | 93,421 | 10.81 | 3 | –1 | |
| Janata Party | 52,530 | 6.08 | 4 | –6 | |
| Communist Party of India | 35,852 | 4.15 | 1 | –4 | |
| Indian Congress (Socialist) | 28,156 | 3.26 | 0 | New | |
| Kuki National Assembly | 13,367 | 1.55 | 1 | –1 | |
| Bharatiya Janata Party | 6,163 | 0.71 | 0 | New | |
| Lok Dal | 3,653 | 0.42 | 0 | New | |
| Communist Party of India (Marxist) | 790 | 0.09 | 0 | –1 | |
| Independents | 372,766 | 43.12 | 21 | +2 | |
| Total | 864,507 | 100.00 | 60 | 0 | |
| Valid votes | 864,507 | 97.70 | |||
| Invalid/blank votes | 20,362 | 2.30 | |||
| Total votes | 884,869 | 100.00 | |||
| Registered voters/turnout | 1,013,680 | 87.29 | |||
| Source: ECI[5] | |||||
Mizoram
 | |||||
| Party | Votes | % | Seats | +/– | |
|---|---|---|---|---|---|
| Indian National Congress (I) | 74,005 | 39.81 | 20 | ||
| Mizoram People's Conference | 66,065 | 35.54 | 8 | ||
| Independents | 45,819 | 24.65 | 2 | ||
| Total | 185,889 | 100.00 | 30 | 0 | |
| Valid votes | 185,889 | 98.68 | |||
| Invalid/blank votes | 2,490 | 1.32 | |||
| Total votes | 188,379 | 100.00 | |||
| Registered voters/turnout | 256,530 | 73.43 | |||
| Source: ECI[6] | |||||
Tamilnadu

Election map of results based on parties. Colours are based on the results table on the left
| Alliance/Party | Seats won | Change | Popular Vote | Vote % | Adj. %‡ | |
|---|---|---|---|---|---|---|
| AIADMK+ alliance | 195 | +29 | 11,681,221 | 53.9% | ||
| AIADMK | 132 | +3 | 8,030,809 | 37.0% | 54.3% | |
| INC | 61 | +30 | 3,529,708 | 16.3% | 54.5% | |
| Indian National Congress breakaway parties | 2 | -4 | 120,704 | 0.6% | 40.4% | |
| DMK+ alliance | 34 | -25 | 8,021,293 | 37.0% | ||
| DMK | 24 | -13 | 6,362,770 | 29.3% | 40.8% | |
| CPI(M) | 5 | -6 | 597,622 | 2.8% | 39.6% | |
| JP | 3 | +1 | 493,374 | 2.3% | 36.4% | |
| CPI | 2 | -7 | 567,527 | 2.6% | 35.5% | |
| Others | 5 | -4 | 1,983,959 | 9.1% | ||
| Independent | 4 | -4 | 1,619,921 | 7.5% | 7.9% | |
| AKD | 1 | – | 47,212 | 0.7% | 57.2% | |
| TNC | 0 | – | 152,315 | 0.7% | 34.9% | |
| Indian Congress (J) | 0 | – | 110,121 | 0.5% | 3.2% | |
| BJP | 0 | – | 54,390 | 0.3% | 3.7% | |
| Total | 234 | – | 21,686,473 | 100% | – | |
References
- ECI
- ECI
- "Arunachal Pradesh Election results, 1984". Election Commission of India.
- "Statistical Report on General Election, 1984 to the Legislative Assembly of Goa". Election Commission of India. Retrieved 29 November 2021.
- "Statistical Report on General Election, 1984 to the Legislative Assembly of Manipur". Election Commission of India. Retrieved 22 October 2021.
- "Statistical Report on General Election, 1984 to the Legislative Assembly of Mizoram". Election Commission of India. Retrieved 15 July 2021.
- "1984 Election Statistical Report" (PDF). Election Commission of India. Archived from the original (PDF) on 7 October 2010. Retrieved 19 April 2009.
External links
| Wikimedia Commons has media related to 1984 elections in India. |
| General elections | |
|---|---|
| State elections |
|
| |
| British Raj | |||||
|---|---|---|---|---|---|
| Parliament of India | |||||
| State Legislative Assembly |
| ||||
| State Legislative Council |
| ||||
This article is issued from Wikipedia. The text is licensed under Creative Commons - Attribution - Sharealike. Additional terms may apply for the media files.