1979 Danish general election
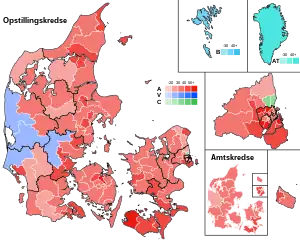
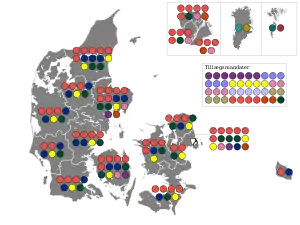
General elections were held in Denmark on 23 October 1979.[1] The Social Democratic Party remained the largest in the Folketing, with 68 of the 179 seats. Voter turnout was 85.6% in Denmark proper, 65.4% in the Faroe Islands and 50.3% in Greenland.[2]
| |||||||||||||||||||||||||||||||||||||||||||||||||||||||||||||||||||||||||||||||||||||||||||
All 179 seats in the Folketing 90 seats needed for a majority | |||||||||||||||||||||||||||||||||||||||||||||||||||||||||||||||||||||||||||||||||||||||||||
| Turnout | 85.2% | ||||||||||||||||||||||||||||||||||||||||||||||||||||||||||||||||||||||||||||||||||||||||||
|---|---|---|---|---|---|---|---|---|---|---|---|---|---|---|---|---|---|---|---|---|---|---|---|---|---|---|---|---|---|---|---|---|---|---|---|---|---|---|---|---|---|---|---|---|---|---|---|---|---|---|---|---|---|---|---|---|---|---|---|---|---|---|---|---|---|---|---|---|---|---|---|---|---|---|---|---|---|---|---|---|---|---|---|---|---|---|---|---|---|---|---|
This lists parties that won seats. See the complete results below.
| |||||||||||||||||||||||||||||||||||||||||||||||||||||||||||||||||||||||||||||||||||||||||||
Results
 | ||||||
|---|---|---|---|---|---|---|
| Denmark | ||||||
| Party | Votes | % | Seats | +/– | ||
| Social Democratic Party | 1,213,456 | 38.3 | 68 | +3 | ||
| Venstre | 396,484 | 12.5 | 22 | +1 | ||
| Conservative People's Party | 395,653 | 12.5 | 22 | +7 | ||
| Progress Party | 349,243 | 11.0 | 20 | –6 | ||
| Socialist People's Party | 187,284 | 5.9 | 11 | +4 | ||
| Danish Social Liberal Party | 172,365 | 5.4 | 10 | +4 | ||
| Left Socialists | 116,047 | 3.7 | 6 | +1 | ||
| Centre Democrats | 102,132 | 3.2 | 6 | –5 | ||
| Justice Party of Denmark | 83,238 | 2.6 | 5 | –1 | ||
| Christian People's Party | 82,133 | 2.6 | 5 | –1 | ||
| Communist Party of Denmark | 58,901 | 1.9 | 0 | –7 | ||
| Communist Workers Party | 13,070 | 0.4 | 0 | New | ||
| Independents | 996 | 0.0 | 0 | 0 | ||
| Invalid/blank votes | 23,343 | – | – | – | ||
| Total | 3,194,345 | 100 | 175 | 0 | ||
| Faroe Islands | ||||||
| Union Party | 5,700 | 30.5 | 1 | 0 | ||
| Social Democratic Party | 4,435 | 23.7 | 1 | 0 | ||
| Republican Party | 3,386 | 18.1 | 0 | 0 | ||
| People's Party | 3,005 | 16.1 | 0 | 0 | ||
| Progress and Fisheries Party | 878 | 4.7 | 0 | New | ||
| Self-Government Party | 797 | 4.3 | 0 | New | ||
| Invalid/blank votes | 80 | – | – | – | ||
| Total | 18,781 | 100 | 2 | 0 | ||
| Greenland | ||||||
| Atassut | 6,390 | 44.9 | 1 | New | ||
| Siumut | 6,273 | 44.1 | 1 | New | ||
| Labour Party | 1,572 | 11.0 | 0 | New | ||
| Invalid/blank votes | 957 | – | – | – | ||
| Total | 15,192 | 100 | 2 | 0 | ||
| Source: Nohlen & Stöver | ||||||
References
- Dieter Nohlen & Philip Stöver (2010) Elections in Europe: A data handbook, p524 ISBN 978-3-8329-5609-7
- Nohlen & Stöver, p545
| Folketing elections |
|
|---|---|
| Landsting elections | |
| European elections | |
| Local elections | |
| Other elections |
|
| Referendums | |
| |
This article is issued from Wikipedia. The text is licensed under Creative Commons - Attribution - Sharealike. Additional terms may apply for the media files.