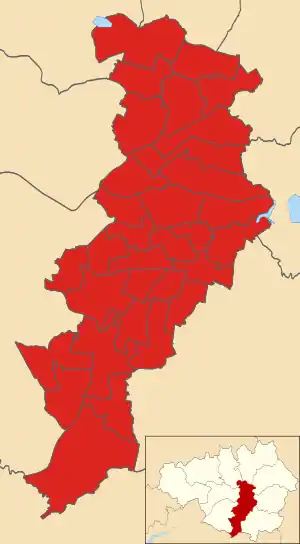
Manchester City Council elections
In Manchester, England, one third of Manchester City Council is elected each year for three consecutive years, followed by a fourth year without any elections. The Labour Party has had political control in Manchester since 1973.

Seats held by party after each election to Manchester City Council, 1973-2021
Political control
| Party in control | Years |
|---|---|
| Labour | 1973–present |
Council elections
Summary of the council composition after council elections, click on the year for full details of each election. Boundary changes took place for the 2004 election which reduced the number of seats by 3, leading to the whole council being elected in that year.

Popular vote share, 1973-2012

Popular vote figures, 1973-2012
| Year | Labour | Conservative | Liberal Democrats | Greens | Independent | |||||
| 1973 | 59 | 40 | 0 | 0 | 0 | |||||
| 1975 | 54 | 45 | 0 | 0 | 0 | |||||
| 1976 | 54 | 45 | 0 | 0 | 0 | |||||
| 1978 | 53 | 46 | 0 | 0 | 0 | |||||
| 1979 | 63 | 33 | 3 | 0 | 0 | |||||
| 1980 | 72 | 23 | 4 | 0 | 0 | |||||
| 1982 | 69 | 26 | 4 | 0 | 0 | |||||
| 1983 | 72 | 22 | 5 | 0 | 0 | |||||
| 1984 | 79 | 14 | 6 | 0 | 0 | |||||
| 1986 | 86 | 7 | 6 | 0 | 0 | |||||
| 1987 | 77 | 13 | 9 | 0 | 0 | |||||
| 1988 | 78 | 12 | 9 | 0 | 0 | |||||
| 1990 | 78 | 12 | 9 | 0 | 0 | |||||
| 1991 | 85 | 5 | 9 | 0 | 0 | |||||
| 1992 | 80 | 5 | 12 | 0 | 2 | |||||
| 1994 | 79 | 4 | 15 | 0 | 1 | |||||
| 1995 | 83 | 2 | 14 | 0 | 0 | |||||
| 1996 | 84 | 0 | 15 | 0 | 0 | |||||
| 1998 | 84 | 0 | 15 | 0 | 0 | |||||
| 1999 | 80 | 0 | 19 | 0 | 0 | |||||
| 2000 | 78 | 0 | 21 | 0 | 0 | |||||
| 2002 | 76 | 0 | 22 | 0 | 1 | |||||
| 2003 | 71 | 0 | 27 | 1 | 0 | |||||
| 2004 | 57 | 0 | 38 | 1 | 0 | |||||
| 2006 | 61 | 0 | 34 | 1 | 0 | |||||
| 2007 | 60 | 0 | 35 | 1 | 0 | |||||
| 2008 | 61 | 1 | 34 | 0 | 0 | |||||
| 2010 | 62 | 1 | 33 | 0 | 0 | |||||
| 2011 | 75 | 0 | 20 | 0 | 1 | |||||
| 2012 | 86 | 0 | 9 | 0 | 1 | |||||
| 2014 | 95 | 0 | 0 | 0 | 1 | |||||
| 2015 | 96 | 0 | 0 | 0 | 0 | |||||
| 2016 | 95 | 0 | 1 | 0 | 0 | |||||
| 2018 | 94 | 0 | 2 | 0 | 0 | |||||
| 2019 | 93 | 0 | 3 | 0 | 0 | |||||
| 2021 | 93 | 0 | 1 | 1 | 0 | |||||
Borough result maps
 2004 results map
 2006 results map
 2007 results map
 2008 results map
 2010 results map
 2011 results map
 2012 results map
 2014 results map
 2015 results map
 2016 results map
By-election results
See also
- Category:Councillors in Manchester – list of councillors serving on Manchester City Council
- Politics in Manchester
External links
This article is issued from Wikipedia. The text is licensed under Creative Commons - Attribution - Sharealike. Additional terms may apply for the media files.
