Heywood and Royton (UK Parliament constituency)
Heywood and Royton was a parliamentary constituency centred on the Heywood and Royton districts in the north-west of Greater Manchester. It returned one Member of Parliament (MP) to the House of Commons of the Parliament of the United Kingdom.
| Heywood and Royton | |
|---|---|
| Former Borough constituency for the House of Commons | |
| 1950–1983 | |
| Number of members | one |
| Replaced by | Littleborough & Saddleworth, Heywood & Middleton, Oldham Central & Royton, Rossendale & Darwen and Rochdale[1] |
| Created from | Heywood and Radcliffe and Royton[2] |
The constituency was created for the 1950 general election, and abolished for the 1983 general election, when its territory was largely divided between the new constituencies of Heywood & Middleton and Oldham Central & Royton.
Boundaries
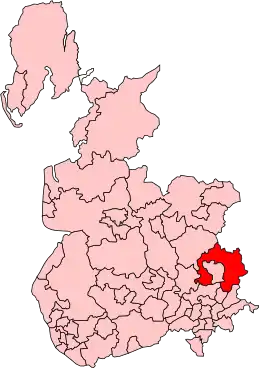
Heywood and Royton in Lancashire, boundaries used 1974-83
The Borough of Heywood, and the Urban Districts of Crompton, Littleborough, Milnrow, Royton, Wardle, and Whitworth.
Members of Parliament
| Election | Member | Party | |
|---|---|---|---|
| 1950 | Sir Harold Sutcliffe | Conservative | |
| 1955 | Tony Leavey | Conservative | |
| 1964 | Joel Barnett | Labour | |
| 1983 | constituency abolished: see Heywood and Middleton & Oldham Central and Royton | ||
Elections
Elections in the 1950s
| Party | Candidate | Votes | % | ±% | |
|---|---|---|---|---|---|
| Conservative | Harold Sutcliffe | 23,518 | 44.04 | ||
| Labour | Charles J Hurley | 21,482 | 40.23 | ||
| Liberal | William Hibbert Watkinson | 8,404 | 15.74 | ||
| Majority | 2,036 | 3.81 | |||
| Turnout | 87.98 | ||||
| Conservative hold | Swing | ||||
| Party | Candidate | Votes | % | ±% | |
|---|---|---|---|---|---|
| Conservative | Harold Sutcliffe | 28,086 | 53.84 | ||
| Labour | Charles J Hurley | 24,083 | 46.16 | ||
| Majority | 4,003 | 7.67 | |||
| Turnout | 85.08 | ||||
| Conservative hold | Swing | ||||
| Party | Candidate | Votes | % | ±% | |
|---|---|---|---|---|---|
| Conservative | Tony Leavey | 25,824 | 53.31 | ||
| Labour | Alan Lever Tillotson | 22,614 | 46.69 | ||
| Majority | 3,210 | 6.63 | |||
| Turnout | 81.82 | ||||
| Conservative hold | Swing | ||||
| Party | Candidate | Votes | % | ±% | |
|---|---|---|---|---|---|
| Conservative | Tony Leavey | 19,742 | 40.25 | ||
| Labour | Harry Nevin | 17,588 | 35.86 | ||
| Liberal | Geoffrey Eugene MacPherson | 11,713 | 23.88 | ||
| Majority | 2,154 | 4.39 | |||
| Turnout | 84.75 | ||||
| Conservative hold | Swing | ||||
Elections in the 1960s
| Party | Candidate | Votes | % | ±% | |
|---|---|---|---|---|---|
| Labour | Joel Barnett | 20,174 | 40.80 | ||
| Conservative | Tony Leavey | 19,358 | 39.15 | ||
| Liberal | Wilfred Eric Critchley | 9,914 | 20.05 | ||
| Majority | 816 | 1.65 | |||
| Turnout | 82.78 | ||||
| Labour gain from Conservative | Swing | ||||
| Party | Candidate | Votes | % | ±% | |
|---|---|---|---|---|---|
| Labour | Joel Barnett | 24,701 | 48.93 | ||
| Conservative | David Waddington | 19,048 | 37.73 | ||
| Liberal | James Clarney | 6,732 | 13.34 | ||
| Majority | 5,653 | 11.20 | |||
| Turnout | 79.58 | ||||
| Labour hold | Swing | ||||
Elections in the 1970s
| Party | Candidate | Votes | % | ±% | |
|---|---|---|---|---|---|
| Labour | Joel Barnett | 25,081 | 45.70 | ||
| Conservative | Ian MacGregor | 24,178 | 44.06 | ||
| Liberal | Francis Joseph Beetham | 5,620 | 10.24 | ||
| Majority | 903 | 1.65 | |||
| Turnout | 76.13 | ||||
| Labour hold | Swing | ||||
| Party | Candidate | Votes | % | ±% | |
|---|---|---|---|---|---|
| Labour | Joel Barnett | 28,216 | 44.32 | ||
| Conservative | Ian MacGregor | 21,054 | 33.07 | ||
| Liberal | Viv Bingham | 14,392 | 22.61 | ||
| Majority | 7,162 | 11.25 | |||
| Turnout | 82.62 | ||||
| Labour hold | Swing | ||||
| Party | Candidate | Votes | % | ±% | |
|---|---|---|---|---|---|
| Labour | Joel Barnett | 27,206 | 45.74 | ||
| Conservative | Peter Morgan | 19,307 | 32.46 | ||
| Liberal | Viv Bingham | 12,969 | 21.80 | ||
| Majority | 7,899 | 13.28 | |||
| Turnout | 76.55 | ||||
| Labour hold | Swing | ||||
| Party | Candidate | Votes | % | ±% | |
|---|---|---|---|---|---|
| Labour | Joel Barnett | 28,489 | 45.24 | ||
| Conservative | Peter Morgan | 26,202 | 41.61 | ||
| Liberal | M Hewitt | 7,644 | 12.14 | ||
| National Front | R Marsh | 641 | 1.02 | ||
| Majority | 2,287 | 3.63 | |||
| Turnout | 76.61 | ||||
| Labour hold | Swing | ||||
References
- "'Heywood and Royton', Feb 1974 - May 1983". ElectionWeb Project. Cognitive Computing Limited. Retrieved 22 March 2016.
- Craig, F.W.S., ed. (1972). Boundaries of parliamentary constituencies 1985-1972. Chichester, Sussex: Political Reference Publications. ISBN 0-900178-09-4.
This article is issued from Wikipedia. The text is licensed under Creative Commons - Attribution - Sharealike. Additional terms may apply for the media files.