Dover District Council elections
Political control
Since the first election to the council in 1973 political control of the council has been held by the following parties:[1]
| Party in control | Years |
|---|---|
| Conservative | 1973 - 1991 |
| No overall control | 1991 - 1995 |
| Labour | 1995 - 1999 |
| No overall control | 1999 - 2007 |
| Conservative | 2007–present |
Council elections
- 1973 Dover District Council election
- 1976 Dover District Council election
- 1979 Dover District Council election (New ward boundaries)[2]
- 1983 Dover District Council election
- 1987 Dover District Council election (District boundary changes took place but the number of seats remained the same)[3]
- 1991 Dover District Council election
- 1995 Dover District Council election
- 1999 Dover District Council election
- 2003 Dover District Council election (New ward boundaries reduced the number of seats by 11)[4][5]
- 2007 Dover District Council election
- 2011 Dover District Council election
- 2015 Dover District Council election
- 2019 Dover District Council election
Borough result maps
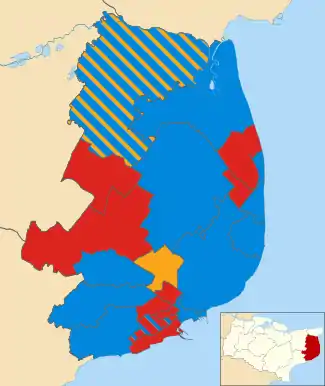 2003 results map
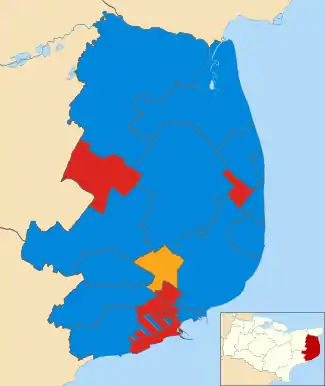 2007 results map
 2011 results map
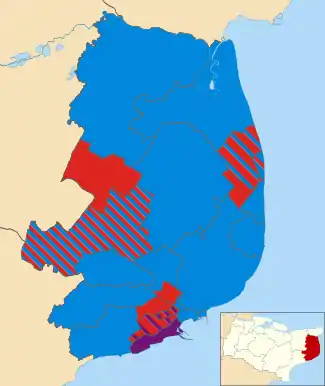 2015 results map
 2019 results map
By-election results
1999-2003
| Party | Candidate | Votes | % | ±% | |
|---|---|---|---|---|---|
| Labour | 755 | 50.3 | -16.0 | ||
| Conservative | 665 | 44.3 | +10.6 | ||
| Liberal Democrats | 81 | 5.4 | +5.4 | ||
| Majority | 90 | 6.0 | |||
| Turnout | 1,501 | 30.2 | |||
| Labour hold | Swing | ||||
| Party | Candidate | Votes | % | ±% | |
|---|---|---|---|---|---|
| Conservative | 558 | 69.2 | +7.4 | ||
| Labour | 248 | 30.8 | -7.4 | ||
| Majority | 310 | 38.4 | |||
| Turnout | 806 | 34.1 | |||
| Conservative hold | Swing | ||||
| Party | Candidate | Votes | % | ±% | |
|---|---|---|---|---|---|
| Conservative | 619 | 71.2 | +1.6 | ||
| Labour | 158 | 18.2 | -13.0 | ||
| Liberal Democrats | 92 | 10.6 | +1.6 | ||
| Majority | 461 | 53.0 | |||
| Turnout | 869 | 35.2 | |||
| Conservative hold | Swing | ||||
| Party | Candidate | Votes | % | ±% | |
|---|---|---|---|---|---|
| Conservative | 245 | 59.5 | -7.1 | ||
| Labour | 99 | 24.0 | -9.4 | ||
| Liberal Democrats | 68 | 16.5 | +16.5 | ||
| Majority | 146 | 35.5 | |||
| Turnout | 412 | 35.2 | |||
| Conservative hold | Swing | ||||
2003-2007
| Party | Candidate | Votes | % | ±% | |
|---|---|---|---|---|---|
| Conservative | Margaret Philpott | 749 | 60.5 | -0.3 | |
| Liberal Democrats | Patrick Acarnley | 234 | 18.9 | +18.9 | |
| Labour | John Adams | 214 | 17.2 | -4.9 | |
| Independent | Stewart Dimmock | 43 | 3.5 | +0.0 | |
| Majority | 515 | 41.6 | |||
| Turnout | 1,239 | 34.5 | |||
| Conservative hold | Swing | ||||
| Party | Candidate | Votes | % | ±% | |
|---|---|---|---|---|---|
| Conservative | Christopher Smith | 1,031 | 61.0 | +0.2 | |
| Labour | Ernest Brimmell | 449 | 26.5 | -12.7 | |
| Liberal Democrats | John Featherstone | 211 | 12.5 | +12.5 | |
| Majority | 582 | 34.5 | |||
| Turnout | 1,691 | 29.2 | |||
| Conservative hold | Swing | ||||
| Party | Candidate | Votes | % | ±% | |
|---|---|---|---|---|---|
| Conservative | Susan Chandler | 892 | |||
| Conservative | Jane Sheridan | 748 | |||
| Liberal Democrats | Bryan Curtis | 336 | |||
| Liberal Democrats | Sheila Smith | 254 | |||
| Labour | Benet Bano | 111 | |||
| Labour | Ernest Brimmel | 110 | |||
| Turnout | 2,451 | 24.3 | |||
| Conservative hold | Swing | ||||
| Conservative gain from Liberal Democrats | Swing | ||||
2007-2011
| Party | Candidate | Votes | % | ±% | |
|---|---|---|---|---|---|
| Labour | Robert Thompson | 661 | 79.7 | +11.4 | |
| Conservative | Marianne Ford | 108 | 13.0 | -12.6 | |
| Independent | Reginald Hansell | 59 | 7.1 | +0.9 | |
| Independent | Edward Lee-Delisle | 1 | 0.1 | +0.1 | |
| Majority | 553 | 66.7 | |||
| Turnout | 829 | 23.7 | |||
| Labour hold | Swing | ||||
| Party | Candidate | Votes | % | ±% | |
|---|---|---|---|---|---|
| Labour | Viviane Revell | 365 | 33.7 | -3.3 | |
| Liberal Democrats | John Mackie | 274 | 25.3 | +6.1 | |
| Conservative | Jennifer Morgan | 252 | 23.3 | -8.2 | |
| Independent | Graham Wanstall | 70 | 6.5 | -5.8 | |
| UKIP | Peter Campbell-Marshall | 65 | 6.0 | +6.0 | |
| Independent | Victor Morgan | 56 | 5.2 | +5.2 | |
| Majority | 91 | 8.4 | |||
| Turnout | 1,082 | 20.2 | |||
| Labour hold | Swing | ||||
| Party | Candidate | Votes | % | ±% | |
|---|---|---|---|---|---|
| Conservative | Mike Conolly | 1,109 | 66.0 | -1.9 | |
| Liberal Democrats | Bryan Curtis | 459 | 27.3 | +5.4 | |
| Labour | John Bird | 113 | 6.7 | -3.5 | |
| Majority | 650 | 38.7 | |||
| Turnout | 1,681 | 31.2 | |||
| Conservative hold | Swing | ||||
| Party | Candidate | Votes | % | ±% | |
|---|---|---|---|---|---|
| Labour | Viv REVELL | 244 | 32.7 | ||
| Conservative | Mandy Marie SEHMBI | 219 | 29.4 | ||
| Liberal Democrats | Dean STILES | 93 | 12.5 | ||
| Dover Alliance | Raymond John WHITE | 86 | 11.5 | ||
| English Democrat | Tony OVENDEN | 72 | 9.7 | ||
| UKIP | Vic MATCHAM | 32 | 4.3 | ||
| Majority | 25 | ||||
| Turnout | 20.86 | ||||
| Labour gain from Independent | Swing | ||||
| Party | Candidate | Votes | % | ±% | |
|---|---|---|---|---|---|
| Conservative | Geoffrey LYMER | 239 | 62.2 | -5.3 | |
| Labour | Peter WALKER | 90 | 23.4 | +0.7 | |
| UKIP | Victor Peter MATCHAM | 55 | 14.3 | +4.7 | |
| Majority | 149 | ||||
| Turnout | 20.3 | ||||
| Conservative hold | Swing | ||||
References
- "Dover". BBC News Online. Retrieved 18 March 2010.
- The District of Dover (Electoral Arrangements) Order 1978
- legislation.gov.uk - The Kent (District Boundaries) Order 1987. Retrieved on 6 November 2015.
- "Local elections". BBC News Online. Retrieved 18 March 2010.
- legislation.gov.uk - The District of Dover (Electoral Changes) Order 2001. Retrieved on 4 October 2015.
- "District Council Elections 15 April 2004". Dover District Council. Retrieved 18 March 2010.
- "Declaration of result of poll" (PDF). Dover District Council. Retrieved 18 March 2010.
- "Declaration of result of poll". Dover District Council. Retrieved 18 March 2010.
- Siddique, Haroon; Mulholland, Helene (28 September 2008). "Unions on standby for imminent election". guardian.co.uk. London. Retrieved 18 March 2010.
- "Declaration of result of poll" (PDF). Dover District Council. Retrieved 18 March 2010.
- "Declaration of result of poll" (PDF). Dover District Council. Retrieved 18 March 2010.
- "Declaration of result of poll" (PDF). Dover District Council. Retrieved 18 March 2010.
- "Declaration of result of poll" (PDF). Dover District Council. Retrieved 16 February 2014.
- "Declaration of result of poll" (PDF). Dover District Council. Retrieved 16 February 2014.
- "Declaration of result of poll" (PDF). Dover District Council. Retrieved 16 February 2014.
External links
| Kent County Council | |
|---|---|
| Ashford Borough Council | |
| Canterbury City Council | |
| Dartford Borough Council | |
| Dover District Council | |
| Folkestone & Hythe District Council | |
| Gravesham Borough Council | |
| Maidstone Borough Council | |
| Medway Council | |
| Orpington Urban District Council |
|
| Sevenoaks District Council | |
| Swale Borough Council | |
| Thanet District Council | |
| Tonbridge & Malling Borough Council | |
| Tunbridge Wells Borough Council | |
| Rochester-upon-Medway City Council |
|
| Gillingham Borough Council |
|
| |
This article is issued from Wikipedia. The text is licensed under Creative Commons - Attribution - Sharealike. Additional terms may apply for the media files.