Canterbury City Council elections
Canterbury City Council is elected every four years.
Political control
| Party in control | Years | |
|---|---|---|
| Conservative | 1973–1991 | |
| No overall control | 1991–2007 | |
| Conservative | 2007–present | |
Council elections
- 1973 Canterbury City Council election
- 1976 Canterbury City Council election
- 1979 Canterbury City Council election (New ward boundaries)[1]
- 1983 Canterbury City Council election
- 1987 Canterbury City Council election (City boundary changes took place but the number of seats remained the same)[2][3]
- 1991 Canterbury City Council election
- 1995 Canterbury City Council election
- 1999 Canterbury City Council election
- 2003 Canterbury City Council election (New ward boundaries)[4]
- 2007 Canterbury City Council election
- 2011 Canterbury City Council election
- 2015 Canterbury City Council election (New ward boundaries)[5]
- 2019 Canterbury City Council election
Result maps
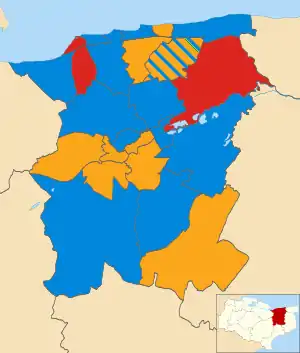 2003 results map
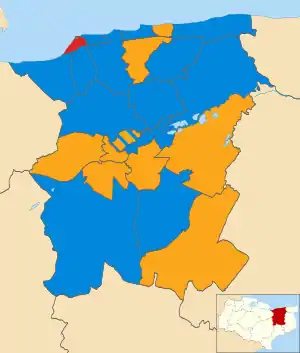 2007 results map
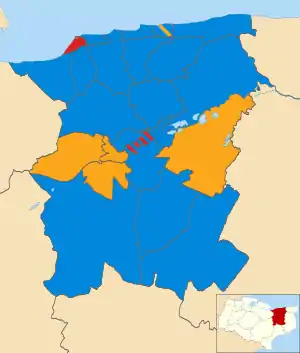 2011 results map
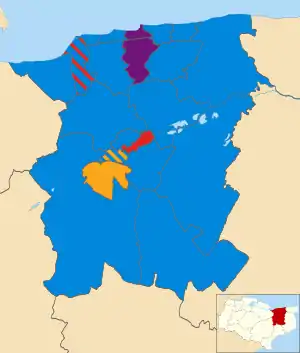 2015 results map
 2019 results map
By-election results
1995-1999
| Party | Candidate | Votes | % | ±% | |
|---|---|---|---|---|---|
| Conservative | 564 | 35.1 | |||
| Liberal Democrats | 552 | 34.4 | |||
| Labour | 490 | 30.5 | |||
| Majority | 12 | 0.7 | |||
| Turnout | 1,606 | 51.0 | |||
| Conservative gain from Liberal Democrats | Swing | ||||
| Party | Candidate | Votes | % | ±% | |
|---|---|---|---|---|---|
| Labour | 577 | 44.1 | -12.1 | ||
| Conservative | 567 | 43.3 | +11.3 | ||
| Liberal Democrats | 151 | 11.5 | -0.4 | ||
| UKIP | 14 | 1.1 | +1.1 | ||
| Majority | 10 | 0.8 | |||
| Turnout | 1,309 | ||||
| Labour hold | Swing | ||||
| Party | Candidate | Votes | % | ±% | |
|---|---|---|---|---|---|
| Labour | 313 | 49.8 | -13.2 | ||
| Conservative | 183 | 29.1 | +2.0 | ||
| Liberal Democrats | 133 | 21.1 | +13.8 | ||
| Majority | 130 | 20.7 | |||
| Turnout | 629 | ||||
| Labour hold | Swing | ||||
1999-2003
| Party | Candidate | Votes | % | ±% | |
|---|---|---|---|---|---|
| Liberal Democrats | Heather Lloyd | 329 | 38.3 | +21.6 | |
| Conservative | Elizabeth Taylor | 289 | 33.7 | -0.6 | |
| Labour | Alan Thomas | 241 | 28.1 | -21.0 | |
| Majority | 40 | 4.6 | |||
| Turnout | 859 | 44.3 | |||
| Liberal Democrats gain from Labour | Swing | ||||
| Party | Candidate | Votes | % | ±% | |
|---|---|---|---|---|---|
| Liberal Democrats | Nigel Oakes | 867 | 37.6 | +5.2 | |
| Conservative | Alan White | 797 | 34.5 | +9.0 | |
| Labour | David Hornsby | 344 | 14.9 | -2.6 | |
| Green | Carol Davis | 187 | 8.1 | -3.0 | |
| UKIP | John Moore | 112 | 4.9 | +4.9 | |
| Majority | 70 | 3.1 | |||
| Turnout | 2,307 | 26.8 | |||
| Liberal Democrats hold | Swing | ||||
| Party | Candidate | Votes | % | ±% | |
|---|---|---|---|---|---|
| Conservative | Michael Northey | 1,184 | 35.4 | -2.3 | |
| Liberal Democrats | Valerie Ainscough | 1,177 | 35.2 | -11.6 | |
| Labour | Theresa Mawson | 824 | 24.6 | +9.0 | |
| Green | Steven Dawe | 163 | 4.9 | +4.9 | |
| Majority | 7 | 0.2 | |||
| Turnout | 3,348 | 62.4 | |||
| Conservative gain from Liberal Democrats | Swing | ||||
2003-2007
| Party | Candidate | Votes | % | ±% | |
|---|---|---|---|---|---|
| Conservative | John Anderson | 544 | 50.9 | -5.3 | |
| Liberal Democrats | Janet Horsley | 478 | 44.7 | +0.9 | |
| UKIP | John Moore | 26 | 2.4 | +2.4 | |
| Labour | Paul Todd | 21 | 2.0 | +2.0 | |
| Majority | 66 | 6.2 | |||
| Turnout | 1,069 | 53.0 | |||
| Conservative hold | Swing | ||||
| Party | Candidate | Votes | % | ±% | |
|---|---|---|---|---|---|
| Conservative | Michael Northey | 820 | 44.8 | +10.4 | |
| Liberal Democrats | James Flanagan | 697 | 38.0 | -4.3 | |
| Green | Keith Bothwell | 145 | 7.9 | +0.9 | |
| Labour | Laurence Ward | 100 | 5.5 | -5.1 | |
| Council Tax Payers Party | James Cooper | 70 | 3.8 | -2.0 | |
| Majority | 123 | 6.8 | |||
| Turnout | 1,832 | 31.8 | |||
| Conservative gain from Liberal Democrats | Swing | ||||
| Party | Candidate | Votes | % | ±% | |
|---|---|---|---|---|---|
| Conservative | Vincent McMahan | 1,177 | 37.6 | -13.2 | |
| Liberal Democrats | Kevin Sims | 992 | 31.7 | +13.5 | |
| Labour | Brian Hunter | 754 | 24.1 | -6.9 | |
| UKIP | John Moore | 205 | 6.6 | +6.6 | |
| Majority | 185 | 5.9 | |||
| Turnout | 3,128 | 67.5 | |||
| Conservative hold | Swing | ||||
| Party | Candidate | Votes | % | ±% | |
|---|---|---|---|---|---|
| Conservative | Heather Taylor | 474 | 52.4 | -23.1 | |
| Liberal Democrats | David Mummery | 318 | 35.1 | +23.3 | |
| Labour | Andrew Fenyo | 89 | 9.8 | -2.8 | |
| Independent | John Moore | 24 | 2.6 | +2.6 | |
| Majority | 156 | 17.3 | |||
| Turnout | 905 | 41.3 | |||
| Conservative hold | Swing | ||||
2007-2011
| Party | Candidate | Votes | % | ±% | |
|---|---|---|---|---|---|
| Liberal Democrats | Michael Steed | 993 | 51.8 | +9.3 | |
| Conservative | Mark Evans | 701 | 36.6 | +2.7 | |
| Green | Keith Bothwell | 121 | 6.3 | +6.3 | |
| Independent | Blue Cooper | 102 | 5.3 | -0.7 | |
| Majority | 292 | 15.2 | |||
| Turnout | 1,917 | 33.1 | |||
| Liberal Democrats hold | Swing | ||||
References
- The City of Canterbury (Electoral Arrangements) Order 1976
- The Canterbury and Shepway (Areas) Order 1985
- legislation.gov.uk - The Kent (District Boundaries) Order 1987. Retrieved on 6 November 2015.
- legislation.gov.uk - The City of Canterbury (Electoral Changes) Order 2001. Retrieved on 4 October 2015.
- "The Canterbury (Electoral Changes) Order 2014". legislation.gov.uk.
- "Barton Ward By Election Results". Canterbury City Council. Archived from the original on 23 December 2012. Retrieved 20 July 2008.
External links
| Kent County Council | |
|---|---|
| Ashford Borough Council | |
| Canterbury City Council | |
| Dartford Borough Council | |
| Dover District Council | |
| Folkestone & Hythe District Council | |
| Gravesham Borough Council | |
| Maidstone Borough Council | |
| Medway Council | |
| Orpington Urban District Council |
|
| Sevenoaks District Council | |
| Swale Borough Council | |
| Thanet District Council | |
| Tonbridge & Malling Borough Council | |
| Tunbridge Wells Borough Council | |
| Rochester-upon-Medway City Council |
|
| Gillingham Borough Council |
|
| |
This article is issued from Wikipedia. The text is licensed under Creative Commons - Attribution - Sharealike. Additional terms may apply for the media files.