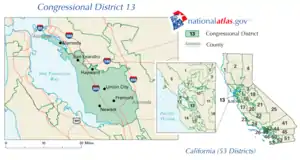
California's 13th congressional district
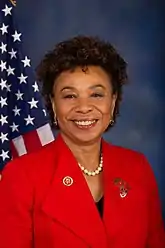
California's 13th congressional district is a congressional district in the U.S. state of California. Barbara Lee, a Democrat, has represented this district since January 2013.
| California's 13th congressional district | |||
|---|---|---|---|
.tif.png.webp) California's 13th congressional district since January 3, 2013 | |||
| Representative |
| ||
| Population (2019) | 768,889 | ||
| Median household income | $91,514[1] | ||
| Ethnicity |
| ||
| Cook PVI | D+40[2] | ||
Currently, the 13th district consists of the northwestern portion of Alameda County. Cities in the district include Alameda, Albany, Berkeley, Emeryville, Oakland, Piedmont, and San Leandro.[3] With a Cook Partisan Voting Index rating of D+40, it is the most Democratic district in California.[2]
Prior to redistricting by the California Citizens Redistricting Commission of 2011, the 13th district was in southwestern Alameda County, anchored by Hayward and Fremont.
Recent election results from statewide races
| Year | Office | Results |
|---|---|---|
| 1992 | President | Clinton 54.4 - 25.6% |
| Senator | Boxer 58.0 - 31.4% | |
| Senator | Feinstein 66.1 - 26.9% | |
| 1994 | Governor[4] | Brown 51.0 - 44.7% |
| Senator[5] | Feinstein 59.3 - 32.8% | |
| 1996 | President[6] | Clinton 62.3- 27.5% |
| 1998 | Governor[7] | Davis 68.9 - 27.7% |
| Senator[8] | Boxer 63.0 - 33.5% | |
| 2000 | President[9] | Gore 66.4 - 29.6% |
| Senator[10] | Feinstein 66.9 - 27.3% | |
| 2002 | Governor[11] | Davis 62.8 - 26.7% |
| 2003 | Recall[12][13] | No 63.2 - 36.8% |
| Bustamante 46.8 - 31.5% | ||
| 2004 | President[14] | Kerry 70.9 - 28.0% |
| Senator[15] | Boxer 72.8 - 23.2% | |
| 2006 | Governor[16] | Angelides 52.1 - 42.4% |
| Senator[17] | Feinstein 75.0 - 20.0% | |
| 2008 | President[18] | Obama 74.4 - 23.8% |
| 2010 | Governor | Brown 68.7 - 27.4% |
| Senator | Boxer 69.4 - 25.9% | |
| 2012 | President | Obama 87.5 - 9.0% |
| Senator | Feinstein 90.9 - 9.1% | |
| 2014 | Governor | Brown 91.2 - 8.8% |
| 2016 | President | Clinton 87.4 - 6.8% |
| Senator | Harris 80.9 - 19.1% | |
| 2018 | Governor | Newsom 90.2 - 9.8% |
| Senator | Feinstein 58.9 - 41.1% | |
| 2020 | President | Biden 88.9 - 9.0% |
List of members representing the district
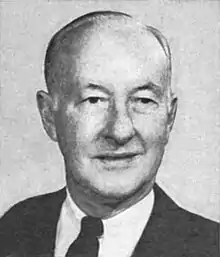
.jpg.webp)


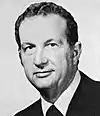
.jpg.webp)


.tif.png.webp)
Election results
|
1932 • 1934 • 1936 • 1938 • 1940 • 1942 • 1944 • 1946 • 1948 • 1950 • 1952 • 1954 • 1956 • 1958 • 1960 • 1962 • 1964 • 1966 • 1968 • 1970 • 1972 • 1974 (Special) • 1974 • 1976 • 1978 • 1980 • 1982 • 1984 • 1986 • 1988 • 1990 • 1992 • 1994 • 1996 • 1998 • 2000 • 2002 • 2004 • 2006 • 2008 • 2010 • 2012 • 2014 • 2016 • 2018 • 2020 |
1932
| Party | Candidate | Votes | % | ||
|---|---|---|---|---|---|
| Democratic | Charles Kramer | 65,261 | 52.7 | ||
| Republican | Charles H. Randall | 53,449 | 43.1 | ||
| Liberty | George D. Higgins | 5,237 | 4.2 | ||
| Total votes | 123,947 | 100.0 | |||
| Turnout | |||||
| Democratic win (new seat) | |||||
1934
| Party | Candidate | Votes | % | |
|---|---|---|---|---|
| Democratic | Charles Kramer (Incumbent) | 83,384 | 62.5 | |
| Republican | Thomas K. Case | 27,993 | 21.0 | |
| Prohibition | Charles H. Randall | 18,760 | 14.1 | |
| Socialist | Michael S. Kerrigan | 2,113 | 1.6 | |
| Communist | John J. Graham | 1,268 | 0.9 | |
| Total votes | 133,518 | 100.0 | ||
| Turnout | ||||
| Democratic hold | ||||
1936
| Party | Candidate | Votes | % | |
|---|---|---|---|---|
| Democratic | Charles Kramer (Incumbent) | 119,251 | 90.0 | |
| No party | Floyd Seaman (write-in) | 6,946 | 5.2 | |
| Communist | Emma Cutler | 6,362 | 4.8 | |
| Total votes | 132,559 | 100.0 | ||
| Turnout | ||||
| Democratic hold | ||||
1938
| Party | Candidate | Votes | % | |
|---|---|---|---|---|
| Democratic | Charles Kramer (Incumbent) | 96,258 | 65.9 | |
| Republican | K. L. Stockton | 44,808 | 30.7 | |
| Communist | Louis Baron | 5,104 | 3.4 | |
| Total votes | 146,170 | 100.0 | ||
| Turnout | ||||
| Democratic hold | ||||
1940
| Party | Candidate | Votes | % | |
|---|---|---|---|---|
| Democratic | Charles Kramer (Incumbent) | 127,167 | 75.7 | |
| Prohibition | Charles H. Randall | 36,406 | 21.7 | |
| Communist | Celeste Strack | 4,434 | 2.6 | |
| Total votes | 168,007 | 100.0 | ||
| Turnout | ||||
| Democratic hold | ||||
1942
| Party | Candidate | Votes | % | |||
|---|---|---|---|---|---|---|
| Republican | Norris Poulson | 38,577 | 49.5 | |||
| Democratic | Charles Kramer (Incumbent) | 33,060 | 42.4 | |||
| Townsend | Calvert S. Wilson | 6,306 | 8.1 | |||
| Total votes | 77,943 | 100.0 | ||||
| Turnout | ||||||
| Republican gain from Democratic | ||||||
1944
| Party | Candidate | Votes | % | |||
|---|---|---|---|---|---|---|
| Democratic | Ned R. Healy | 66,854 | 55 | |||
| Republican | Norris Poulson (Incumbent) | 54,792 | 45 | |||
| Total votes | 121,646 | 100 | ||||
| Turnout | ||||||
| Democratic gain from Republican | ||||||
1946
| Party | Candidate | Votes | % | |||
|---|---|---|---|---|---|---|
| Republican | Norris Poulson | 48,071 | 51.8 | |||
| Democratic | Ned R. Healy (Incumbent) | 44,712 | 48.2 | |||
| Total votes | 92,783 | 100.0 | ||||
| Turnout | ||||||
| Republican gain from Democratic | ||||||
1948
| Party | Candidate | Votes | % | |
|---|---|---|---|---|
| Republican | Norris Poulson (Incumbent) | 62,951 | 52.6 | |
| Democratic | Ned R. Healy | 56,624 | 47.4 | |
| Total votes | 119,575 | 100.0 | ||
| Turnout | ||||
| Republican hold | ||||
1950
| Party | Candidate | Votes | % | |
|---|---|---|---|---|
| Republican | Norris Poulson (Incumbent) | 83,296 | 84.9 | |
| Progressive | Ellen P. Davidson | 14,789 | 15.1 | |
| Total votes | 98,085 | 100.0 | ||
| Turnout | ||||
| Republican hold | ||||
1952
| Party | Candidate | Votes | % | |
|---|---|---|---|---|
| Republican | Ernest K. Bramblett (Incumbent) | 79,496 | 51 | |
| Democratic | Will Hays | 76,516 | 49 | |
| Total votes | 156,012 | 100 | ||
| Turnout | ||||
| Republican hold | ||||
1954
| Party | Candidate | Votes | % | |
|---|---|---|---|---|
| Republican | Charles M. Teague | 69,287 | 52.5 | |
| Democratic | Timothy I. O'Reilly | 62,786 | 47.5 | |
| Total votes | 132,073 | 100.0 | ||
| Turnout | ||||
| Republican hold | ||||
1956
| Party | Candidate | Votes | % | |
|---|---|---|---|---|
| Republican | Charles M. Teague (Incumbent) | 104,009 | 59.6 | |
| Democratic | William Kirk Stewart | 70,567 | 40.4 | |
| Total votes | 174,576 | 100.0 | ||
| Turnout | ||||
| Republican hold | ||||
1958
| Party | Candidate | Votes | % | |
|---|---|---|---|---|
| Republican | Charles M. Teague (Incumbent) | 98,381 | 57 | |
| Democratic | William Kirk Stewart | 74,160 | 43 | |
| Total votes | 172,541 | 100 | ||
| Turnout | ||||
| Republican hold | ||||
1960
| Party | Candidate | Votes | % | |
|---|---|---|---|---|
| Republican | Charles M. Teague (Incumbent) | 146,072 | 65 | |
| Democratic | George J. Holgate | 78,597 | 35 | |
| Total votes | 224,669 | 100 | ||
| Turnout | ||||
| Republican hold | ||||
1962
| Party | Candidate | Votes | % | |
|---|---|---|---|---|
| Republican | Charles M. Teague (Incumbent) | 84,743 | 64.9 | |
| Democratic | George J. Holgate | 45,746 | 35.1 | |
| Total votes | 130,489 | 100.0 | ||
| Turnout | ||||
| Republican hold | ||||
1964
| Party | Candidate | Votes | % | |
|---|---|---|---|---|
| Republican | Charles M. Teague (Incumbent) | 104,744 | 57.4 | |
| Democratic | George E. Taylor | 77,763 | 42.6 | |
| Total votes | 182,507 | 100.0 | ||
| Turnout | ||||
| Republican hold | ||||
1966
| Party | Candidate | Votes | % | |
|---|---|---|---|---|
| Republican | Charles M. Teague (Incumbent) | 116,701 | 67.5 | |
| Democratic | Charles A. Storke | 56,240 | 32.5 | |
| Total votes | 172,941 | 100.0 | ||
| Turnout | ||||
| Republican hold | ||||
1968
| Party | Candidate | Votes | % | |
|---|---|---|---|---|
| Republican | Charles M. Teague (Incumbent) | 148,357 | 65.9 | |
| Democratic | Stanley K. Sheinbaum | 76,928 | 34.1 | |
| Total votes | 225,285 | 100.0 | ||
| Turnout | ||||
| Republican hold | ||||
1970
| Party | Candidate | Votes | % | |
|---|---|---|---|---|
| Republican | Charles M. Teague (Incumbent) | 125,507 | 58.2 | |
| Democratic | Gary Hart | 87,980 | 40.8 | |
| American Independent | Maude I. Jordet | 2,339 | 1.0 | |
| Total votes | 215,826 | 100.0 | ||
| Turnout | ||||
| Republican hold | ||||
1972
| Party | Candidate | Votes | % | |
|---|---|---|---|---|
| Republican | Charles M. Teague (Incumbent) | 153,723 | 73.9 | |
| Democratic | Lester Dean Cleveland | 54,237 | 27.1 | |
| Total votes | 207,960 | 100.0 | ||
| Turnout | ||||
| Republican hold | ||||
1974 (Special)
| Party | Candidate | Votes | % | |
|---|---|---|---|---|
| Republican | Robert J. Lagomarsino | 53.7 | ||
| Democratic | James D. Loebl | 18.8 | ||
| Democratic | James A. Browning Jr. | 7.8 | ||
| Democratic | Roger A. Ikola | 6.3 | ||
| Democratic | E.T. "Tom" Jolicoeur | 6.0 | ||
| Democratic | David H. Miller | 3.2 | ||
| Democratic | R.W. Handley | 2.4 | ||
| Democratic | F. Joe Deauchamp | 1.9 | ||
| Total votes | 100.0 | |||
| Turnout | ||||
| Republican hold | ||||
1974
| Party | Candidate | Votes | % | |||
|---|---|---|---|---|---|---|
| Democratic | Norm Mineta | 78,649 | 52.6 | |||
| Republican | George W. Milias | 63,381 | 42.4 | |||
| Peace and Freedom | Elizabeth Cervantes Barron | 3,846 | 2.6 | |||
| American Independent | Floyd S. Stancliffe | 3,738 | 2.5 | |||
| Total votes | 149,614 | 100.0 | ||||
| Turnout | ||||||
| Democratic gain from Republican | ||||||
1976
| Party | Candidate | Votes | % | |
|---|---|---|---|---|
| Democratic | Norm Mineta (Incumbent) | 135,291 | 66.8 | |
| Republican | Ernie Konnyu | 63,130 | 31.2 | |
| American Independent | William Pollock Herrell | 4,190 | 2.1 | |
| Total votes | 202,611 | 100.0 | ||
| Turnout | ||||
| Democratic hold | ||||
1978
| Party | Candidate | Votes | % | |
|---|---|---|---|---|
| Democratic | Norm Mineta (Incumbent) | 100,809 | 57.5 | |
| Republican | Dan O'Keefe | 69,306 | 39.5 | |
| Peace and Freedom | Robert Goldsborough III | 5,246 | 3.0 | |
| Total votes | 175,361 | 100.0 | ||
| Turnout | ||||
| Democratic hold | ||||
1980
| Party | Candidate | Votes | % | |
|---|---|---|---|---|
| Democratic | Norm Mineta (Incumbent) | 132,246 | 58.9 | |
| Republican | W. E. "Ted" Gagne | 79,766 | 35.5 | |
| Libertarian | Ray Strong | 8,806 | 3.9 | |
| Peace and Freedom | Robert Goldsborough | 3,791 | 1.7 | |
| Total votes | 224,609 | 100.0 | ||
| Turnout | ||||
| Democratic hold | ||||
1982
| Party | Candidate | Votes | % | |
|---|---|---|---|---|
| Democratic | Norm Mineta (Incumbent) | 110,805 | 65.9 | |
| Republican | Tom Kelly | 52,806 | 31.4 | |
| Libertarian | Al Hinkle | 4,553 | 2.7 | |
| Total votes | 168,164 | 100.0 | ||
| Turnout | ||||
| Democratic hold | ||||
1984
| Party | Candidate | Votes | % | |
|---|---|---|---|---|
| Democratic | Norm Mineta (Incumbent) | 139,851 | 65.2 | |
| Republican | John D. "Jack" Williams | 70,666 | 33.0 | |
| Libertarian | John R. Redding | 3,836 | 1.8 | |
| Total votes | 214,353 | 100.0 | ||
| Turnout | ||||
| Democratic hold | ||||
1986
| Party | Candidate | Votes | % | |
|---|---|---|---|---|
| Democratic | Norm Mineta (Incumbent) | 107,696 | 69.7 | |
| Republican | Bob Nash | 46,754 | 30.3 | |
| Total votes | 154,450 | 100.0 | ||
| Turnout | ||||
| Democratic hold | ||||
1988
| Party | Candidate | Votes | % | |
|---|---|---|---|---|
| Democratic | Norm Mineta (Incumbent) | 143,980 | 67.1 | |
| Republican | Luke Somner | 63,959 | 29.8 | |
| Libertarian | John H. Webster | 6,583 | 3.1 | |
| Total votes | 214,522 | 100.0 | ||
| Turnout | ||||
| Democratic hold | ||||
1990
| Party | Candidate | Votes | % | |
|---|---|---|---|---|
| Democratic | Norm Mineta (Incumbent) | 97,286 | 58.0 | |
| Republican | David E. Smith | 59,773 | 35.7 | |
| Libertarian | John H. Webster | 10,587 | 6.3 | |
| Total votes | 167,646 | 100.0 | ||
| Turnout | ||||
| Democratic hold | ||||
1992
| Party | Candidate | Votes | % | |
|---|---|---|---|---|
| Democratic | Pete Stark (Incumbent) | 123,795 | 60.2 | |
| Republican | Verne W. Teyler | 64,953 | 31.6 | |
| Peace and Freedom | Roslyn A. Allen | 16,768 | 8.2 | |
| Total votes | 205,516 | 100.0 | ||
| Turnout | ||||
| Democratic hold | ||||
1994
| Party | Candidate | Votes | % | |
|---|---|---|---|---|
| Democratic | Pete Stark (Incumbent) | 97,344 | 64.62 | |
| Republican | Larry Molton | 45,555 | 30.24 | |
| Libertarian | Robert "Bob" Gough | 7,743 | 5.14 | |
| Total votes | 150,642 | 100.00 | ||
| Turnout | ||||
| Democratic hold | ||||
1996
| Party | Candidate | Votes | % | |
|---|---|---|---|---|
| Democratic | Pete Stark (Incumbent) | 114,408 | 65.2 | |
| Republican | James Fay | 53,385 | 30.4 | |
| Libertarian | Terry Savage | 7,746 | 4.4 | |
| Total votes | 176,539 | 100.0 | ||
| Turnout | ||||
| Democratic hold | ||||
1998
| Party | Candidate | Votes | % | |
|---|---|---|---|---|
| Democratic | Pete Stark (Incumbent) | 101,671 | 71.20 | |
| Republican | James R. Goetz | 38,050 | 26.65 | |
| Natural Law | Karnig Beylikjian | 3,066 | 4.4 | |
| Total votes | 142,787 | 100.0 | ||
| Turnout | ||||
| Democratic hold | ||||
2000
| Party | Candidate | Votes | % | |
|---|---|---|---|---|
| Democratic | Pete Stark (Incumbent) | 129,012 | 70.5 | |
| Republican | James R. "Jim" Goetz | 44,499 | 24.3 | |
| Libertarian | Howard Mora | 4,623 | 2.6 | |
| Natural Law | Timothy R. Hoehner | 2,647 | 1.4 | |
| American Independent | Don J. Grundmann | 2,365 | 1.2 | |
| Total votes | 183,146 | 100.0 | ||
| Turnout | ||||
| Democratic hold | ||||
2002
| Party | Candidate | Votes | % | |
|---|---|---|---|---|
| Democratic | Pete Stark (Incumbent) | 86,495 | 71.1 | |
| Republican | Syed R. Mahmoud | 26,852 | 22.1 | |
| Libertarian | Mark R. Stroberg | 3,703 | 3.1 | |
| American Independent | Don J. Grundmann | 2,772 | 2.2 | |
| Reform | John J. Bambey | 1,901 | 1.5 | |
| Total votes | 121,723 | 100.0 | ||
| Turnout | ||||
| Democratic hold | ||||
2004
| Party | Candidate | Votes | % | |
|---|---|---|---|---|
| Democratic | Pete Stark (Incumbent) | 144,605 | 71.7 | |
| Republican | George I. Bruno | 48,439 | 28.2 | |
| Libertarian | Mark R. Stroberg | 8,877 | 4.3 | |
| Total votes | 201,921 | 100.0 | ||
| Turnout | ||||
| Democratic hold | ||||
2006
| Party | Candidate | Votes | % | |
|---|---|---|---|---|
| Democratic | Pete Stark (Incumbent) | 144,409 | 74.9 | |
| Republican | George I. Bruno | 27,141 | 25.1 | |
| Total votes | 171,500 | 100.0 | ||
| Turnout | ||||
| Democratic hold | ||||
2008
| Party | Candidate | Votes | % | |
|---|---|---|---|---|
| Democratic | Pete Stark (Incumbent) | 166,829 | 76.5 | |
| Republican | Raymond Chui | 51,447 | 23.5 | |
| Total votes | 218,276 | 100.0 | ||
| Turnout | ||||
| Democratic hold | ||||
2010
| Party | Candidate | Votes | % | |
|---|---|---|---|---|
| Democratic | Pete Stark (Incumbent) | 118,278 | 72.19 | |
| Republican | Forest Baker | 45,545 | 27.81 | |
| Democratic hold | ||||
2012
| Party | Candidate | Votes | % | |
|---|---|---|---|---|
| Democratic | Barbara Lee (Incumbent) | 250,436 | 87% | |
| No party preference | Marilyn M. Singleton | 38,146 | 13% | |
| Total votes | 288,582 | 100.0% | ||
| Democratic hold | ||||
2014
| Party | Candidate | Votes | % | |
|---|---|---|---|---|
| Democratic | Barbara Lee (Incumbent) | 168,491 | 89% | |
| Republican | Dakin Sundeen | 21,940 | 11% | |
| Total votes | 190,431 | 100.0% | ||
| Democratic hold | ||||
2016
| Party | Candidate | Votes | % | |
|---|---|---|---|---|
| Democratic | Barbara Lee (Incumbent) | 293,117 | 91% | |
| Republican | Sue Caro | 29,754 | 9% | |
| Total votes | 322,871 | 100.0% | ||
| Democratic hold | ||||
2018
| Party | Candidate | Votes | % | |
|---|---|---|---|---|
| Democratic | Barbara Lee (Incumbent) | 260,580 | 88% | |
| Green | Laura Wells | 34,257 | 11% | |
| Total votes | 294,837 | 100.0% | ||
| Democratic hold | ||||
2020
| Party | Candidate | Votes | % | |
|---|---|---|---|---|
| Democratic | Barbara Lee (incumbent) | 327,863 | 90.4 | |
| Republican | Nikka Piterman | 34,955 | 9.6 | |
| Total votes | 362,818 | 100.0 | ||
| Democratic hold | ||||
References
- "My Congressional District".
- "Introducing the 2021 Cook Political Report Partisan Voter Index". The Cook Political Report. April 15, 2021. Retrieved April 15, 2021.
- "Maps: Final Congressional Districts". Citizens Redistricting Commission. Archived from the original on March 10, 2013. Retrieved February 25, 2013.
- https://elections.cdn.sos.ca.gov/sov/1994-general/ssov/governor-congress-district.pdf
- https://elections.cdn.sos.ca.gov/sov/1994-general/ssov/us-senate-congress-district.pdf
- https://elections.cdn.sos.ca.gov/sov/1996-general/ssov/president-congress-district.pdf
- (PDF). September 29, 2011 https://web.archive.org/web/20110929224728/http://www.sos.ca.gov/elections/sov/1998-general/ssov/gov-cd.pdf#. Archived from the original (PDF) on September 29, 2011.
{{cite web}}: Missing or empty|title=(help) - (PDF). September 29, 2011 https://web.archive.org/web/20110929224732/http://www.sos.ca.gov/elections/sov/1998-general/ssov/sen-cd.pdf#. Archived from the original (PDF) on September 29, 2011.
{{cite web}}: Missing or empty|title=(help) - "Statement of Vote (2000 President)" (PDF). Archived from the original (PDF) on June 11, 2007. Retrieved September 17, 2008.
- "Statement of Vote (2000 Senator)" (PDF). Archived from the original (PDF) on June 11, 2007. Retrieved September 17, 2008.
- "Statement of Vote (2002 Governor)" (PDF). Archived from the original (PDF) on November 11, 2010.
- "Statement of Vote (2003 Recall Question)" (PDF). Archived from the original (PDF) on May 20, 2011. Retrieved October 8, 2007.
- "Statement of Vote (2003 Governor)" (PDF). Archived from the original (PDF) on May 20, 2011. Retrieved October 8, 2007.
- "Statement of Vote (2004 President)" (PDF). Archived from the original (PDF) on August 1, 2010. Retrieved August 8, 2007.
- "Statement of Vote (2004 Senator)" (PDF). Archived from the original (PDF) on August 10, 2011.
- "Statement of Vote (2006 Governor)" (PDF). Archived from the original (PDF) on August 10, 2011.
- "Statement of Vote (2006 Senator)" (PDF). Archived from the original (PDF) on August 10, 2011.
- "(2008 President)". Archived from the original on February 11, 2009. Retrieved March 5, 2009.
- "1932 election results" (PDF).
- "1934 election results" (PDF).
- "1936 election results" (PDF).
- "1938 election results" (PDF).
- "1940 election results" (PDF).
- "1942 election results" (PDF).
- "1944 election results" (PDF).
- "1946 election results" (PDF).
- "1948 election results" (PDF).
- "1950 election results" (PDF).
- "1952 election results" (PDF).
- "1954 election results" (PDF).
- "1956 election results" (PDF).
- "1958 election results" (PDF).
- "1960 election results" (PDF).
- "1962 election results" (PDF).
- "1964 election results" (PDF).
- "1966 election results" (PDF).
- "1968 election results" (PDF).
- "1970 election results" (PDF).
- "1972 election results" (PDF).
- "JoinCalifornia - 03-05-1974 Election". www.joincalifornia.com.
- "1974 election results" (PDF).
- "1976 election results" (PDF).
- "1978 election results" (PDF).
- "1980 election results" (PDF).
- "1982 election results" (PDF).
- "1984 election results" (PDF).
- "1986 election results" (PDF).
- "1988 election results" (PDF).
- "1990 election results" (PDF).
- "1992 election results" (PDF).
- "1994 election results" (PDF).
- "1996 election results" (PDF).
- "1998 election results" (PDF).
- "2000 election results" (PDF).
- "2002 general election results" (PDF). Archived from the original (PDF) on February 3, 2009.
- "2004 general election results" (PDF). Archived from the original (PDF) on August 21, 2008.
- "2006 general election results" (PDF). Archived from the original (PDF) on November 27, 2008.
- "2008 general election results" (PDF). Archived from the original (PDF) on October 18, 2012. Retrieved January 5, 2009.
- "2010 general election results" (PDF). Archived from the original (PDF) on June 11, 2014. Retrieved March 24, 2011.
- "2012 general election results" (PDF). Archived from the original (PDF) on October 19, 2013.
External links
- GovTrack.us: California's 13th congressional district
- RAND California Election Returns: District Definitions (out of date)
- California Voter Foundation map - CD13 (out of date)