California's 2nd congressional district
California's 2nd congressional district is a U.S. congressional district in California. Jared Huffman, a Democrat, has represented the district since January 2013. Currently, it encompasses the northern coast of the state. It stretches from the Golden Gate Bridge to the Oregon border, and includes all of Highway 101 north of San Francisco, except for a stretch in Sonoma County. It consists of Marin, Mendocino, Humboldt, Del Norte, and Trinity counties, plus portions of Sonoma County. Cities in the district include San Rafael, Petaluma, Novato, Windsor, Healdsburg, Ukiah, Fort Bragg, Fortuna, Eureka, Arcata, McKinleyville, and Crescent City.[4]
| California's 2nd congressional district | |||
|---|---|---|---|
.tif.png.webp) California's 2nd congressional district since January 3, 2013 | |||
| Representative |
| ||
| Population (2019) | 708,434[1] | ||
| Median household income | $80,051[2] | ||
| Ethnicity |
| ||
| Cook PVI | D+23[3] | ||
History
From 2003 until the redistricting by the California Citizens Redistricting Commission that took effect in 2013, the 2nd district encompassed much of the far northern part of the state, from the Central Valley north of Sacramento to the Oregon border. It was the largest district by area in California. It consisted of Colusa, Glenn, Shasta, Siskiyou, Sutter, Tehama, Trinity, and Yuba counties, plus portions of Butte and Yolo counties.
The district had a dramatically different political history than its current incarnation. While the current 2nd is one of the most Democratic districts in California, the old 2nd had been a Republican stronghold for almost three decades. Much of this territory is now the 1st district, while most of the current 2nd had been split between the 1st and 6th districts from 2003 to 2013.
Election results from statewide races
| Year | Office | Results |
|---|---|---|
| 1990 | Governor[5] | Wilson 56.8% - 37.4% |
| 1992 | President[6] | Bush 38.7 – 35.7% |
| Senator[7] | Herschensohn 52.7 – 35.6% | |
| Senator (Special)[7] | Seymour 47.0 – 42.7% | |
| 1994 | Governor[8] | Wilson 64.2 – 29.7% |
| Senator[9] | Huffington 57.8 – 32.8% | |
| 1996 | President[10] | Dole 50.9 – 36.1% |
| 1998 | Governor[11] | Lungren 50.6% – 45.1% |
| Senator[12] | Fong 56.3% – 38.3% | |
| 2000 | President[13] | Bush 59.2 – 34.1% |
| Senator[14] | Campbell 50.9 – 39.5% | |
| 2002 | Governor[15] | Simon 57.6 – 31.1% |
| 2003 | Recall[16][17] | |
| Schwarzenegger 57.6 – 18.5% | ||
| 2004 | President[18] | Bush 62.0 – 36.6% |
| Senator[19] | Jones 55.5 – 39.6% | |
| 2006 | Governor[20] | Schwarzenegger 70.5 – 23.7% |
| Senator[21] | Mountjoy 51.8 – 42.0% | |
| 2008 | President[22] | McCain 55.0 – 42.6% |
| 2010 | Governor[23] | Whitman 55.2 – 37.6% |
| Senator[24] | Fiorina 60.2 – 31.9% | |
| 2012 | President[25] | Obama 68.7 – 26.8% |
| Senator[26] | Feinstein 72.6 – 27.4% | |
| 2014 | Governor[27] | Brown 73.5 – 26.5% |
| 2016 | President[28] | Clinton 69.0 – 23.3% |
| Senator[29] | Harris 73.8 – 26.2% | |
| 2018 | Governor[30] | Newsom 72.1 – 27.9% |
| Senator[31] | Feinstein 56.6 – 43.4% | |
| 2020 | President[32] | Biden 73.6 – 23.9% |
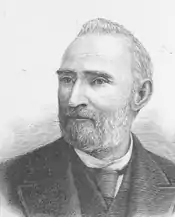
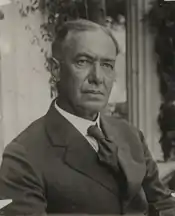
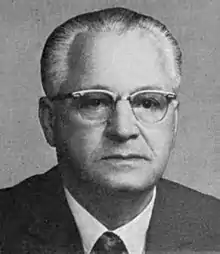
List of members representing the district
District created March 4, 1865.


.jpg.webp)
.jpg.webp)

.jpg.webp)
.jpg.webp)


.jpg.webp)


.tif.png.webp)
Election results
1864
| Party | Candidate | Votes | % | |
|---|---|---|---|---|
| Republican | William Higby | 23,414 | 61.6 | |
| Democratic | James W. Coffroth | 14,581 | 38.4 | |
| Total votes | 37,995 | 100.0 | ||
| Turnout | ||||
| Republican hold | ||||
1867
| Party | Candidate | Votes | % | |
|---|---|---|---|---|
| Republican | William Higby (incumbent) | 16,053 | 52.0 | |
| Democratic | James W. Coffroth | 14,786 | 48.0 | |
| Total votes | 30,839 | 100.0 | ||
| Turnout | ||||
| Republican hold | ||||
1868
| Party | Candidate | Votes | % | |
|---|---|---|---|---|
| Republican | Aaron Augustus Sargent | 18,264 | 54.7 | |
| Democratic | James W. Coffroth | 15,124 | 45.3 | |
| Total votes | 33,388 | 100.0 | ||
| Turnout | ||||
| Republican hold | ||||
1871
| Party | Candidate | Votes | % | |
|---|---|---|---|---|
| Republican | Aaron Augustus Sargent (incumbent) | 18,065 | 54.0 | |
| Democratic | James W. Coffroth | 15,382 | 46.0 | |
| Total votes | 33,447 | 100.0 | ||
| Turnout | ||||
| Republican hold | ||||
1872
| Party | Candidate | Votes | % | |
|---|---|---|---|---|
| Republican | Horace F. Page | 13,803 | 51.9 | |
| Democratic | Pasz Coggins | 12,816 | 48.1 | |
| Total votes | 26,619 | 100.0 | ||
| Turnout | ||||
| Republican hold | ||||
1875
| Party | Candidate | Votes | % | |
|---|---|---|---|---|
| Republican | Horace F. Page (incumbent) | 13,624 | 43.4 | |
| Democratic | Hy Larkin | 12,154 | 38.8 | |
| Independent | Charles R. Tuttle | 5,589 | 17.8 | |
| Total votes | 31,367 | 100.0 | ||
| Turnout | ||||
| Republican hold | ||||
1876
| Party | Candidate | Votes | % | |
|---|---|---|---|---|
| Republican | Horace F. Page (incumbent) | 20,815 | 56.7 | |
| Democratic | G. J. Carpenter | 15,916 | 43.3 | |
| Total votes | 36,731 | 100.0 | ||
| Turnout | ||||
| Republican hold | ||||
1879
| Party | Candidate | Votes | % | |
|---|---|---|---|---|
| Republican | Horace F. Page (incumbent) | 19,386 | 51.9 | |
| Democratic | Thomas J. Clunie | 12,847 | 34.4 | |
| Workingman's | H. B. Williams[41] | 5,139 | 13.8 | |
| Total votes | 37,372 | 100.0 | ||
| Turnout | ||||
| Republican hold | ||||
1880
| Party | Candidate | Votes | % | |
|---|---|---|---|---|
| Republican | Horace F. Page (incumbent) | 22,038 | 53.6 | |
| Democratic | John R. Glasscock | 18,859 | 45.9 | |
| Greenback | Benjamin Todd [43] | 296 | 0.4 | |
| Prohibition | B. K. Lowe | 41 | 0.1 | |
| Total votes | 41,118 | 100.0 | ||
| Turnout | ||||
| Republican hold | ||||
1882
| Party | Candidate | Votes | % | |||
|---|---|---|---|---|---|---|
| Democratic | James Budd | 20,229 | 50.5 | |||
| Republican | Horace F. Page (incumbent) | 19,246 | 48.1 | |||
| Prohibition | J. L. Coles | 478 | 1.2 | |||
| Greenback | F. J. Woodward [45] | 78 | 0.2 | |||
| Total votes | 40,031 | 100.0 | ||||
| Turnout | ||||||
| Democratic gain from Republican | ||||||
1884
| Party | Candidate | Votes | % | |||
|---|---|---|---|---|---|---|
| Republican | James A. Louttit | 18,327 | 49.4 | |||
| Democratic | Charles Allen Sumner | 18,208 | 49.1 | |||
| Prohibition | Joshua B. Webster | 558 | 1.5 | |||
| Total votes | 37,093 | 100.0 | ||||
| Turnout | ||||||
| Republican gain from Democratic | ||||||
1886
| Party | Candidate | Votes | % | |||
|---|---|---|---|---|---|---|
| Democratic | Marion Biggs | 17,667 | 50.0 | |||
| Republican | J. C. Campbell | 16,594 | 47.0 | |||
| Prohibition | W. O. Clark | 1,076 | 3.0 | |||
| Total votes | 35,337 | 100.0 | ||||
| Turnout | ||||||
| Democratic gain from Republican | ||||||
1888
| Party | Candidate | Votes | % | |
|---|---|---|---|---|
| Democratic | Marion Biggs (incumbent) | 19,064 | 50.6 | |
| Republican | John A. Eagon | 17,541 | 46.6 | |
| Independent | S. M. McLean | 913 | 2.4 | |
| Know Nothing | J. F. McSwain [49] | 138 | 0.4 | |
| Total votes | 37,656 | 100.0 | ||
| Turnout | ||||
| Democratic hold | ||||
1890
| Party | Candidate | Votes | % | |
|---|---|---|---|---|
| Democratic | Anthony Caminetti | 18,644 | 49.0 | |
| Republican | George G. Blanchard | 18,485 | 48.6 | |
| Prohibition | J. S. Witherell | 912 | 2.4 | |
| Total votes | 38,041 | 100.0 | ||
| Turnout | ||||
| Democratic hold | ||||
1892
| Party | Candidate | Votes | % | |
|---|---|---|---|---|
| Democratic | Anthony Caminetti (incumbent) | 20,741 | 53.3 | |
| Republican | John F. Davis | 16,781 | 43.1 | |
| Prohibition | Chauncey H. Dunn | 1,307 | 3.4 | |
| Independent | J. H. White | 122 | 0.3 | |
| Total votes | 38,951 | 100.0 | ||
| Turnout | ||||
| Democratic hold | ||||
1894
| Party | Candidate | Votes | % | |||
|---|---|---|---|---|---|---|
| Republican | Grove L. Johnson | 19,302 | 43.0 | |||
| Democratic | Anthony Caminetti (incumbent) | 15,732 | 35.1 | |||
| Populist | Burdell Cornell | 8,946 | 20.0 | |||
| Prohibition | Elam Briggs | 866 | 1.9 | |||
| Total votes | 44,846 | 100.0 | ||||
| Turnout | ||||||
| Republican gain from Democratic | ||||||
1896
| Party | Candidate | Votes | % | |||
|---|---|---|---|---|---|---|
| Democratic | Marion De Vries | 24,434 | 55.5 | |||
| Republican | Grove L. Johnson (incumbent) | 18,613 | 42.3 | |||
| Prohibition | F. E. Coulter | 974 | 2.2 | |||
| Total votes | 44,021 | 100.0 | ||||
| Turnout | ||||||
| Democratic gain from Republican | ||||||
1898
| Party | Candidate | Votes | % | |
|---|---|---|---|---|
| Democratic | Marion De Vries (incumbent) | 25,196 | 55.3 | |
| Republican | Frank D. Ryan | 20,400 | 44.7 | |
| Total votes | 45,596 | 100.0 | ||
| Turnout | ||||
| Democratic hold | ||||
1900 (Special)
| Party | Candidate | Votes | % | |||
|---|---|---|---|---|---|---|
| Republican | Samuel D. Woods | N/A | 51.0 | |||
| Democratic | J. D. Sproul | N/A | 49.0 | |||
| Total votes | N/A | 100.0 | ||||
| Turnout | ||||||
| Republican gain from Democratic | ||||||
1900 (General)
| Party | Candidate | Votes | % | |||
|---|---|---|---|---|---|---|
| Republican | Samuel D. Woods | 23,019 | 50.4 | |||
| Democratic | J. D. Sproul | 21,851 | 47.9 | |||
| Social Democrat | W. F. Lockwood [57] | 402 | 0.9 | |||
| Prohibition | W. H. Barron | 371 | 0.8 | |||
| Total votes | 45,643 | 100.0 | ||||
| Turnout | ||||||
| Republican gain from Democratic | ||||||
1902
| Party | Candidate | Votes | % | |||
|---|---|---|---|---|---|---|
| Democratic | Theodore A. Bell | 21,536 | 49.2 | |||
| Republican | Frank Coombs (incumbent) | 21,181 | 48.3 | |||
| Socialist | G. H. Rogers | 731 | 1.7 | |||
| Prohibition | W. P. Fassett | 367 | 0.8 | |||
| Total votes | 43,815 | 100.0 | ||||
| Turnout | ||||||
| Democratic gain from Republican | ||||||
1904
| Party | Candidate | Votes | % | |||
|---|---|---|---|---|---|---|
| Republican | Duncan E. McKinlay (incumbent) | 22,873 | 49.2 | |||
| Democratic | Theodore A. Bell | 21,640 | 46.6 | |||
| Socialist | J. H. White | 1,524 | 3.3 | |||
| Prohibition | Eli P. LaCell | 431 | 0.9 | |||
| Total votes | 46,468 | 100.0 | ||||
| Turnout | ||||||
| Republican gain from Democratic | ||||||
1906
| Party | Candidate | Votes | % | |
|---|---|---|---|---|
| Republican | Duncan E. McKinlay (incumbent) | 23,411 | 51.8 | |
| Democratic | W. A. Beard | 20,262 | 44.8 | |
| Socialist | A. J. Gaylord | 1,524 | 3.4 | |
| Total votes | 45,197 | 100.0 | ||
| Turnout | ||||
| Republican hold | ||||
1908
| Party | Candidate | Votes | % | |
|---|---|---|---|---|
| Republican | Duncan E. McKinlay (incumbent) | 28,627 | 57.5 | |
| Democratic | W. K. Hays | 19,193 | 38.5 | |
| Socialist | A. J. Gaylord | 2,003 | 4.0 | |
| Total votes | 49,823 | 100.0 | ||
| Turnout | ||||
| Republican hold | ||||
1910
| Party | Candidate | Votes | % | |
|---|---|---|---|---|
| Republican | William Kent | 25,346 | 50.1 | |
| Democratic | I. G. Zumwalt | 22,229 | 44.0 | |
| Socialist | W. H. Ferber | 2,647 | 5.2 | |
| Prohibition | Henry P. Stipp | 329 | 0.7 | |
| Total votes | 50,451 | 100.0 | ||
| Turnout | ||||
| Republican hold | ||||
1912
| Party | Candidate | Votes | % | |
|---|---|---|---|---|
| Democratic | John E. Raker (incumbent) | 23,467 | 62.6 | |
| Republican | Frank M. Rutherford | 10,178 | 27.2 | |
| Socialist | J. C. Williams | 3,818 | 10.2 | |
| Total votes | 37,463 | 100.0 | ||
| Turnout | ||||
| Democratic hold | ||||
1914
| Party | Candidate | Votes | % | |
|---|---|---|---|---|
| Democratic | John E. Raker (incumbent) | 32,575 | 64.7 | |
| Republican | James T. Matlock | 15,716 | 31.2 | |
| Prohibition | W. P. Fassett | 2,086 | 4.1 | |
| Total votes | 50,377 | 100.0 | ||
| Turnout | ||||
| Democratic hold | ||||
1916
| Party | Candidate | Votes | % | |
|---|---|---|---|---|
| Democratic | John E. Raker (incumbent) | 30,042 | 71.0 | |
| Republican | Edward H. Hart | 12,282 | 29.0 | |
| Total votes | 42,324 | 100 | ||
| Turnout | ||||
| Democratic hold | ||||
1918
| Party | Candidate | Votes | % | |
|---|---|---|---|---|
| Democratic | John E. Raker (incumbent) | 28,249 | 100.0 | |
| Turnout | ||||
| Democratic hold | ||||
1920
| Party | Candidate | Votes | % | |
|---|---|---|---|---|
| Democratic | John E. Raker (incumbent) | 26,172 | 100.0 | |
| Turnout | ||||
| Democratic hold | ||||
1922
| Party | Candidate | Votes | % | |
|---|---|---|---|---|
| Democratic | John E. Raker (incumbent) | 32,981 | 100.0 | |
| Turnout | ||||
| Democratic hold | ||||
1924
| Party | Candidate | Votes | % | |
|---|---|---|---|---|
| Democratic | John E. Raker (incumbent) | 30,590 | 100.0 | |
| Turnout | ||||
| Democratic hold | ||||
1926 (Special)
| Party | Candidate | Votes | % | |||
|---|---|---|---|---|---|---|
| Republican | Harry Lane Englebright | 11,462 | 26.0 | |||
| Republican | Frank J Powers | 10,237 | 23.2 | |||
| Republican | Ferdinand G. Stevenot | 8,763 | 19.9 | |||
| Republican | Marshall De Motte | 8,001 | 18.2 | |||
| Democratic | Robert H De Witt | 5,572 | 12.7 | |||
| Total votes | 44,035 | 100.0 | ||||
| Turnout | ||||||
| Republican gain from Democratic | ||||||
1926
| Party | Candidate | Votes | % | |||
|---|---|---|---|---|---|---|
| Republican | Harry Lane Englebright (incumbent) | 32,264 | 100.0 | |||
| Turnout | ||||||
| Republican gain from Democratic | ||||||
1928
| Party | Candidate | Votes | % | |
|---|---|---|---|---|
| Republican | Harry Lane Englebright (incumbent) | 32,455 | 100.0 | |
| Turnout | ||||
| Republican hold | ||||
1930
| Party | Candidate | Votes | % | |
|---|---|---|---|---|
| Republican | Harry Lane Englebright (incumbent) | 35,941 | 100.0 | |
| Turnout | ||||
| Republican hold | ||||
1932
| Party | Candidate | Votes | % | |
|---|---|---|---|---|
| Republican | Harry Lane Englebright (incumbent) | 43,146 | 100.0 | |
| Turnout | ||||
| Republican hold | ||||
1934
| Party | Candidate | Votes | % | |
|---|---|---|---|---|
| Republican | Harry Lane Englebright (incumbent) | 66,370 | 100.0 | |
| Turnout | ||||
| Republican hold | ||||
1936
| Party | Candidate | Votes | % | |
|---|---|---|---|---|
| Republican | Harry Lane Englebright (incumbent) | 51,416 | 100.0 | |
| Turnout | ||||
| Republican hold | ||||
1938
| Party | Candidate | Votes | % | |
|---|---|---|---|---|
| Republican | Harry Lane Englebright (incumbent) | 71,496 | 100.0 | |
| Turnout | ||||
| Republican hold | ||||
1940
| Party | Candidate | Votes | % | |
|---|---|---|---|---|
| Republican | Harry Lane Englebright (incumbent) | 71,033 | 100.0 | |
| Turnout | ||||
| Republican hold | ||||
1942
| Party | Candidate | Votes | % | |
|---|---|---|---|---|
| Republican | Harry Lane Englebright (incumbent) | 50,094 | 100.0 | |
| Turnout | ||||
| Republican hold | ||||
1943 (Special)
| Party | Candidate | Votes | % | |||
|---|---|---|---|---|---|---|
| Democratic | Clair Engle | 1,721 | 53.3 | |||
| Republican | Grace Engelbright | 1,304 | 40.40 | |||
| Republican | Jesse M. Mayo | 203 | 6.3 | |||
| Total votes | 3,228 | 100.0 | ||||
| Turnout | ||||||
| Democratic gain from Republican | ||||||
1944
| Party | Candidate | Votes | % | |
|---|---|---|---|---|
| Democratic | Clair Engle (incumbent) | 48,201 | 63.8 | |
| Republican | Jesse M. Mayo | 27,312 | 36.2 | |
| Total votes | 75,513 | 100.0 | ||
| Turnout | ||||
| Democratic hold | ||||
1946
| Party | Candidate | Votes | % | |
|---|---|---|---|---|
| Democratic | Clair Engle (incumbent) | 57,895 | 100.0 | |
| Turnout | ||||
| Democratic hold | ||||
1948
| Party | Candidate | Votes | % | |
|---|---|---|---|---|
| Democratic | Clair Engle (incumbent) | 78,555 | 100.0 | |
| Turnout | ||||
| Democratic hold | ||||
1950
| Party | Candidate | Votes | % | |
|---|---|---|---|---|
| Democratic | Clair Engle (incumbent) | 85,103 | 100.0 | |
| Turnout | ||||
| Democratic hold | ||||
1952
| Party | Candidate | Votes | % | |
|---|---|---|---|---|
| Democratic | Clair Engle (incumbent) | 124,179 | 100.0 | |
| Turnout | ||||
| Democratic hold | ||||
1954
| Party | Candidate | Votes | % | |
|---|---|---|---|---|
| Democratic | Clair Engle (incumbent) | 113,104 | 100.0 | |
| Turnout | ||||
| Democratic hold | ||||
1956
| Party | Candidate | Votes | % | |
|---|---|---|---|---|
| Democratic | Clair Engle (incumbent) | 136,544 | 100.0 | |
| Turnout | ||||
| Democratic hold | ||||
1958
| Party | Candidate | Votes | % | |
|---|---|---|---|---|
| Democratic | Harold T. Johnson | 90,850 | 61.0 | |
| Republican | Curtis W. Tarr | 58,199 | 39.0 | |
| Total votes | 149,049 | 100 | ||
| Turnout | ||||
| Democratic hold | ||||
1960
| Party | Candidate | Votes | % | |
|---|---|---|---|---|
| Democratic | Harold T. Johnson (incumbent) | 109,565 | 62.7 | |
| Republican | Curtis W. Tarr | 65,198 | 37.3 | |
| Total votes | 174,763 | 100.0 | ||
| Turnout | ||||
| Democratic hold | ||||
1962
| Party | Candidate | Votes | % | |
|---|---|---|---|---|
| Democratic | Harold T. Johnson (incumbent) | 106,239 | 64.6 | |
| Republican | Frederic H. Nagel | 58,150 | 35.4 | |
| Total votes | 164,389 | 100.0 | ||
| Turnout | ||||
| Democratic hold | ||||
1964
| Party | Candidate | Votes | % | |
|---|---|---|---|---|
| Democratic | Harold T. Johnson (incumbent) | 125,774 | 64.6 | |
| Republican | Chester C. Merriam | 68,835 | 35.4 | |
| Total votes | 194,609 | 100.0 | ||
| Turnout | ||||
| Democratic hold | ||||
1966
| Party | Candidate | Votes | % | |
|---|---|---|---|---|
| Democratic | Harold T. Johnson (incumbent) | 131,145 | 70.9 | |
| Republican | William H. Romack, Jr. | 53,753 | 29.1 | |
| Total votes | 184,898 | 100.0 | ||
| Turnout | ||||
| Democratic hold | ||||
1968
| Party | Candidate | Votes | % | |
|---|---|---|---|---|
| Democratic | Harold T. Johnson (incumbent) | 127,880 | 60.8 | |
| Republican | Osmer E. Dunaway | 78,986 | 37.5 | |
| American Independent | Paul J. Huft | 3,577 | 1.7 | |
| Total votes | 210,443 | 100.0 | ||
| Turnout | ||||
| Democratic hold | ||||
1970
| Party | Candidate | Votes | % | |
|---|---|---|---|---|
| Democratic | Harold T. Johnson (incumbent) | 151,070 | 77.9 | |
| Republican | Lloyd E. Gilbert | 37,223 | 19.2 | |
| American Independent | Jack R. Carrigg | 5,681 | 2.9 | |
| Total votes | 193,974 | 100.0 | ||
| Turnout | ||||
| Democratic hold | ||||
1972
| Party | Candidate | Votes | % | |
|---|---|---|---|---|
| Democratic | Harold T. Johnson (incumbent) | 148,808 | 68.3 | |
| Republican | Francis X. Callahan | 62,381 | 28.6 | |
| American Independent | Dorothy D. Paradis | 6,688 | 3.1 | |
| Total votes | 217,877 | 100.0 | ||
| Turnout | ||||
| Democratic hold | ||||
1974
| Party | Candidate | Votes | % | |
|---|---|---|---|---|
| Republican | Donald H. Clausen (incumbent) | 95,508 | 53 | |
| Democratic | Oscar H. Klee | 76,951 | 42.7 | |
| Peace and Freedom | Carole J. Glass | 7,719 | 4.3 | |
| Total votes | 180,178 | 100.0 | ||
| Turnout | ||||
| Republican hold | ||||
1976
| Party | Candidate | Votes | % | |
|---|---|---|---|---|
| Republican | Donald H. Clausen (incumbent) | 121,290 | 56.0 | |
| Democratic | Oscar H. Klee | 88,829 | 41.0 | |
| Peace and Freedom | Robert B. "Bob" Allred | 6,444 | 3.0 | |
| Total votes | 216,563 | 100 | ||
| Turnout | ||||
| Republican hold | ||||
1978
| Party | Candidate | Votes | % | |
|---|---|---|---|---|
| Republican | Donald H. Clausen (incumbent) | 114,451 | 52.0 | |
| Democratic | Norma Bork | 99,712 | 45.3 | |
| Peace and Freedom | Irv Sutley | 6,097 | 2.8 | |
| Total votes | 220,260 | 100.0 | ||
| Turnout | ||||
| Republican hold | ||||
1980
| Party | Candidate | Votes | % | |
|---|---|---|---|---|
| Republican | Donald H. Clausen (incumbent) | 141,698 | 54.2 | |
| Democratic | Norma K. Bork | 109,789 | 42.0 | |
| Libertarian | Daniel Mosier | 6,833 | 2.6 | |
| Peace and Freedom | Linda D. Wren | 3,354 | 1.3 | |
| Total votes | 261,674 | 100.0 | ||
| Turnout | ||||
| Republican hold | ||||
1982
| Party | Candidate | Votes | % | |
|---|---|---|---|---|
| Republican | Eugene A. Chappie (incumbent) | 116,172 | 57.9 | |
| Democratic | John Newmeyer | 81,314 | 40.5 | |
| Peace and Freedom | Howard Fegarsky | 3,126 | 1.6 | |
| Total votes | 200,612 | 100.0 | ||
| Turnout | ||||
| Republican hold | ||||
1984
| Party | Candidate | Votes | % | |
|---|---|---|---|---|
| Republican | Eugene A. Chappie (incumbent) | 158,679 | 69.5 | |
| Democratic | Harry Cozad | 69,793 | 30.5 | |
| Total votes | 228,472 | 100.0 | ||
| Turnout | ||||
| Republican hold | ||||
1986
| Party | Candidate | Votes | % | |
|---|---|---|---|---|
| Republican | Wally Herger | 109,758 | 58.3 | |
| Democratic | Stephen C. Swendiman | 74,602 | 39.6 | |
| Libertarian | Harry Hugh "Doc" Pendery | 4,054 | 2.2 | |
| Total votes | 188,414 | 100.0 | ||
| Turnout | ||||
| Republican hold | ||||
1988
| Party | Candidate | Votes | % | |
|---|---|---|---|---|
| Republican | Wally Herger (incumbent) | 139,010 | 58.8 | |
| Democratic | Wayne R. Meyer | 91,088 | 38.5 | |
| Libertarian | Harry Hugh "Doc" Pendery | 6,253 | 2.6 | |
| Total votes | 236,351 | 100.0 | ||
| Turnout | ||||
| Republican hold | ||||
1990
| Party | Candidate | Votes | % | |
|---|---|---|---|---|
| Republican | Wally Herger (incumbent) | 133,315 | 63.7 | |
| Democratic | Erwin E. "Bill" Rush | 65,333 | 31.2 | |
| Libertarian | Ross Crain | 10,753 | 5.1 | |
| Total votes | 209,401 | 100.0 | ||
| Turnout | ||||
| Republican hold | ||||
1992
| Party | Candidate | Votes | % | |
|---|---|---|---|---|
| Republican | Wally Herger (incumbent) | 167,247 | 65.2 | |
| Democratic | Elliot Roy Freedman | 71,780 | 28.0 | |
| Libertarian | Harry H. "Doc" Pendery | 17,529 | 6.8 | |
| Total votes | 256,556 | 100.0 | ||
| Turnout | ||||
| Republican hold | ||||
1994
| Party | Candidate | Votes | % | |
|---|---|---|---|---|
| Republican | Wally Herger (incumbent) | 137,864 | 64.2 | |
| Democratic | Mary Jacobs | 55,959 | 26 | |
| American Independent | Devvy Kidd | 15,619 | 7.3 | |
| Libertarian | Harry H. "Doc" Pendery | 5,418 | 2.5 | |
| Total votes | 214,860 | 100.0 | ||
| Turnout | ||||
| Republican hold | ||||
1996
| Party | Candidate | Votes | % | |
|---|---|---|---|---|
| Republican | Wally Herger (incumbent) | 144,913 | 60.9 | |
| Democratic | Roberts Braden | 80,401 | 33.7 | |
| Natural Law | Patrice Thiessen | 7,253 | 3.0 | |
| Libertarian | William Brunner | 5,759 | 2.4 | |
| Republican | Bob Todd (write-in) | 7 | 0.0 | |
| Total votes | 238,333 | 100.0 | ||
| Turnout | ||||
| Republican hold | ||||
1998
| Party | Candidate | Votes | % | |
|---|---|---|---|---|
| Republican | Wally Herger (incumbent) | 128,372 | 62.5 | |
| Democratic | Roberts "Rob" Braden | 70,837 | 34.5 | |
| Natural Law | Patrice Thiessen | 6,138 | 3 | |
| Democratic | Stephen F. Scott (write-in) | 20 | 0.01 | |
| Total votes | 205,367 | 100.0 | ||
| Turnout | ||||
| Republican hold | ||||
2000
| Party | Candidate | Votes | % | |
|---|---|---|---|---|
| Republican | Wally Herger (incumbent) | 168,172 | 65.8 | |
| Democratic | Stan Morgan | 72,075 | 28.2 | |
| Natural Law | John McDermott | 8,910 | 3.4 | |
| Libertarian | Charles R. Martin | 6,699 | 2.6 | |
| Total votes | 255,856 | 100.0 | ||
| Turnout | ||||
| Republican hold | ||||
2002
| Party | Candidate | Votes | % | |
|---|---|---|---|---|
| Republican | Wally Herger (incumbent) | 117,747 | 65.8 | |
| Democratic | Mike Johnson | 52,455 | 29.4 | |
| Natural Law | Patrice Thiessen | 4,860 | 2.7 | |
| Libertarian | Charles R. Martin | 3,923 | 2.1 | |
| Total votes | 178,985 | 100.0 | ||
| Turnout | ||||
| Republican hold | ||||
2004
| Party | Candidate | Votes | % | |
|---|---|---|---|---|
| Republican | Wally Herger (incumbent) | 182,119 | 66.9 | |
| Democratic | Mike Johnson | 90,310 | 33.1 | |
| Total votes | 272,429 | 100.0 | ||
| Turnout | ||||
| Republican hold | ||||
2006
| Party | Candidate | Votes | % | |
|---|---|---|---|---|
| Republican | Wally Herger (incumbent) | 134,911 | 64.2 | |
| Democratic | Arjinderpal Sekhon | 68,234 | 32.5 | |
| Libertarian | E. Kent Hinesley | 7,057 | 3.3 | |
| Total votes | 210,202 | 100.0 | ||
| Turnout | ||||
| Republican hold | ||||
2008
| Party | Candidate | Votes | % | |
|---|---|---|---|---|
| Republican | Wally Herger (incumbent) | 163,459 | 57.9 | |
| Democratic | Jeff Morris | 118,878 | 42.1 | |
| Total votes | 228,356 | 100.00 | ||
| Turnout | ||||
| Republican hold | ||||
2010
| Party | Candidate | Votes | % | |
|---|---|---|---|---|
| Republican | Wally Herger (incumbent) | 129,984 | 57.1 | |
| Democratic | Jim Reed | 97,514 | 42.9% | |
| Total votes | 227,498 | 100 | ||
| Republican hold | ||||
2012
| Party | Candidate | Votes | % | |
|---|---|---|---|---|
| Democratic | Jared Huffman | 226,216 | 71.2 | |
| Republican | Daniel W. Roberts | 91,310 | 28.8 | |
| Total votes | 317,526 | 100.0 | ||
| Democratic hold | ||||
2014
| Party | Candidate | Votes | % | |
|---|---|---|---|---|
| Democratic | Jared Huffman (incumbent) | 163,124 | 75.0 | |
| Republican | Dale K Mensing | 54,400 | 25.0 | |
| Total votes | 217,524 | 100.0 | ||
| Democratic hold | ||||
2016
| Party | Candidate | Votes | % | |
|---|---|---|---|---|
| Democratic | Jared Huffman (incumbent) | 254,194 | 76.9 | |
| Republican | Dale K Mensing | 76,572 | 23.1 | |
| Total votes | 330,766 | 100.0 | ||
| Democratic hold | ||||
2018
| Party | Candidate | Votes | % | |
|---|---|---|---|---|
| Democratic | Jared Huffman (incumbent) | 243,081 | 77.0 | |
| Republican | Dale K. Mensing | 72,576 | 23.0 | |
| Total votes | 315,657 | 100.0 | ||
| Turnout | ||||
| Democratic hold | ||||
2020
| Party | Candidate | Votes | % | |
|---|---|---|---|---|
| Democratic | Jared Huffman (incumbent) | 294,435 | 75.7 | |
| Republican | Dale K. Mensing | 94,320 | 24.3 | |
| Total votes | 388,755 | 100.0 | ||
| Democratic hold | ||||
Notes
California will hold their Primary Elections on June 7, 2022.[119]
The State of California operates under a Top Two Candidates Open Primary system. Under this system, most of the offices (including all U.S. Congressional seats in the State of California) that were previously considered “partisan” are now referred to as “voter-nominated.” The only traditionally “partisan” offices that remain on California ballots are for the offices of President of the United States and for County Central Committees. In a Top Two Candidates Open Primary system, all candidates for a specific office appear on the same ballot and only the top two vote-getters in the Primary Election (regardless of political affiliation) move on to the General Election. Because of this, candidates now declare a “Party Preference” rather than a “Party Affiliation.”[120]
Due to redistricting, the Congressional District numbers in California have changed for the 2022 Election Cycle. Through this process, the District numbers have changed the following ways:[121]
· California's 1st Congressional District will remain California's 1st Congressional District;
· California's 2nd Congressional District will remain California's 2nd Congressional District;
· California's 3rd Congressional District will become California's 8th Congressional District;
· California's 4th Congressional District will become California's 3rd Congressional District;
· California's 5th Congressional District will become California's 4th Congressional District;
· California's 6th Congressional District will become California's 7th Congressional District;
· California's 7th Congressional District will become California's 6th Congressional District;
· California's 8th Congressional District will become California's 23rd Congressional District;
· California's 9th Congressional District will remain California's 9th Congressional District;
· California's 10th Congressional District will become California's 13th Congressional District;
· California's 11th Congressional District will become California's 10th Congressional District;
· California's 12th Congressional District will become California's 11th Congressional District;
· California's 13th Congressional District will become California's 12th Congressional District;
· California's 14th Congressional District will become California's 15th Congressional District;
· California's 15th Congressional District will become California's 14th Congressional District;
· California's 16th Congressional District will become California's 21st Congressional District;
· California's 17th Congressional District will remain California's 17th Congressional District;
· California's 18th Congressional District will become California's 16th Congressional District;
· California's 19th Congressional District will become California's 18th Congressional District;
· California's 20th Congressional District will become California's 19th Congressional District;
· California's 21st Congressional District will become California's 22nd Congressional District;
· California's 22nd Congressional District will become California's 5th Congressional District;
· California's 23rd Congressional District will become California's 20th Congressional District;
· California's 24th Congressional District will remain California's 24th Congressional District;
· California's 25th Congressional District will become California's 27th Congressional District;
· California's 26th Congressional District will remain California's 26th Congressional District;
· California's 27th Congressional District will become California's 28th Congressional District;
· California's 28th Congressional District will become California's 30th Congressional District;
· California's 29th Congressional District will remain California's 29th Congressional District;
· California's 30th Congressional District will become California's 32nd Congressional District;
· California's 31st Congressional District will become California's 33rd Congressional District;
· California's 32nd Congressional District will become California's 31st Congressional District;
· California's 33rd Congressional District will become California's 36th Congressional District;
· California's 34th Congressional District will remain California's 34th Congressional District;
· California's 35th Congressional District will remain California's 35th Congressional District;
· California's 36th Congressional District will become California's 25th Congressional District;
· California's 37th Congressional District will remain California's 37th Congressional District;
· California's 38th Congressional District will remain California's 38th Congressional District;
· California's 39th Congressional District will become California's 40th Congressional District;
· California's 40th Congressional District will become California's 42nd Congressional District;~
· California's 41st Congressional District will become California's 39th Congressional District;
· California's 42nd Congressional District will become California's 41st Congressional District;
· California's 43rd Congressional District will remain California's 43rd Congressional District;
· California's 44th Congressional District will remain California's 44th Congressional District;
· California's 45th Congressional District will become California's 47th Congressional District;
· California's 46th Congressional District will remain California's 46th Congressional District;
· California's 47th Congressional District will become California's 42nd Congressional District;~
· California's 48th Congressional District will become California's 45th Congressional District;
· California's 49th Congressional District will remain California's 49th Congressional District;
· California's 50th Congressional District will become California's 48th Congressional District;
· California's 51st Congressional District will become California's 52nd Congressional District;
· California's 52nd Congressional District will become California's 50th Congressional District;
· California's 53rd Congressional District will become California's 51st Congressional District;
~ Due to Redistricting, the State of California lost a Congressional Seat due to a decrease in total population. That is why this chart shows both the 40th and the 47th Congressional Districts becoming the new 42nd Congressional District.
There are currently six declared candidate for California's new 2nd Congressional District for the 2022 Election Cycle.[121]
| 2022 California's New 2nd Congressional District Primary Elections | |||
| Party | Candidate | Votes | % |
| Democratic | Jared Huffman * | TBD | TBD |
| Democratic | Andy Caffrey + | TBD | TBD |
| Democratic | Beth Hampson | TBD | TBD |
| Republican | Doug Brower | TBD | TBD |
| Republican | Aaron Smith | TBD | TBD |
The incumbent office holder is denoted by an *. Any rumored candidates are denoted by an +.
References
- US Census
- US Census
- "Introducing the 2021 Cook Political Report Partisan Voter Index". The Cook Political Report. April 15, 2021. Retrieved April 15, 2021.
- "Maps: Final Congressional Districts". Citizens Redistricting Commission. Archived from the original on March 10, 2013. Retrieved February 24, 2013.
- Statement of Vote (1990 Governor)
- Statement of Vote (1992 President)
- Statement of Vote (1992 Senate)
- Statement of Vote (1994 Governor)
- Statement of Vote (1994 Senate)
- Statement of Vote (1996 President)
- Statement of Vote (1998 Governor) Archived September 29, 2011, at the Wayback Machine
- Statement of Vote (1998 Senate) Archived September 29, 2011, at the Wayback Machine
- Statement of Vote (2000 President)
- Statement of Vote (2000 Senator)
- Statement of Vote (2002 Governor)
- Statement of Vote (2003 Recall Question)
- Statement of Vote (2003 Governor)
- Statement of Vote (2004 President)
- Statement of Vote (2004 Senator)
- Statement of Vote (2006 Governor)
- Statement of Vote (2006 Senator)
- Statement of Vote (2008 President)
- Statement of Vote (2010 Governor)
- Statement of Vote (2010 Senator)
- Statement of Vote (2012 President)
- Statement of Vote (2012 Senator)
- Statement of Vote (2014 Governor)
- Statement of Vote (2016 President)
- Statement of Vote (2016 Senator)
- Statement of Vote (2018 Governor)
- Statement of Vote (2018 Senator)
- Nir, David. "Daily Kos Elections' presidential results by congressional district for 2020, 2016, and 2012". Daily Kos.
- 1864 election results
- 1867 election results
- 1868 election results
- 1871 election results
- 1872 election results
- 1875 election results
- 1876 election results
- 1879 election results
- Join California
- 1880 election results
- Join California
- 1882 election results
- Join California
- 1884 election results
- 1886 election results
- 1888 election results
- Join California
- 1890 election results
- 1892 election results
- 1894 election results
- 1896 election results
- 1898 election results
- 1900 special election results
- 1900 election results
- Join California
- 1902 election results
- 1904 election results
- 1906 election results
- 1908 election results
- 1910 election results
- 1912 election results
- 1914 election results
- 1916 election results
- 1918 election results
- 1920 election results
- 1922 election results
- 1924 election results
- 1926 special election results
- 1926 election results
- 1928 election results
- 1930 election results
- 1932 election results
- 1934 election results
- 1936 election results
- 1938 election results
- 1940 election results
- 1942 election results
- 1943 special election results
- 1944 election results
- 1946 election results
- 1948 election results
- 1950 election results
- 1952 election results
- 1954 election results
- 1956 election results
- 1958 election results
- 1960 election results
- 1962 election results
- 1964 election results
- 1966 election results
- 1968 election results
- 1970 election results
- 1972 election results
- 1974 election results
- 1976 election results
- 1978 election results
- 1980 election results
- 1982 election results
- 1984 election results
- 1986 election results
- 1988 election results
- 1990 election results
- 1992 election results
- 1994 election results
- 1996 election results
- 1998 election results
- 2000 election results
- 2002 election results
- 2004 election results
- 2006 election results
- 2008 election results
- 2010 election results
- 2012 election results
- 2014 election results
- 2016 election results
- 2018 election results
- Secretary of State, California (January 27, 2022). "Statewide Direct Primary Election". California Secretary of State. Archived from the original on December 23, 2020. Retrieved January 27, 2022.
- Secretary of State, California (January 27, 2022). "California Secretary of State FAQs". California Secretary of State. Archived from the original on December 25, 2014. Retrieved January 27, 2022.
- Gunzburger, Ron. "Politics1 - Online Guide to California Elections, Candidates & Politics". politics1.com. Retrieved January 28, 2022.
External links
- GovTrack.us: California's 2nd congressional district
- RAND California Election Returns: District Definitions (out of date)
- California Voter Foundation map - CD02 (out of date)